

Todd Abraham is Managing Director at Innovaas Solutions. As a fervent digital transformation and Industry 4.0 enthusiast, he set himself the challenge to build a real industrial dashboard using the United Manufacturing Hub (UMH) stack. The objective of the dashboard is to convince Innovaas’ clients of the validity of the UMH. This article tells his learning journey.
Setting up the United Manufacturing Hub
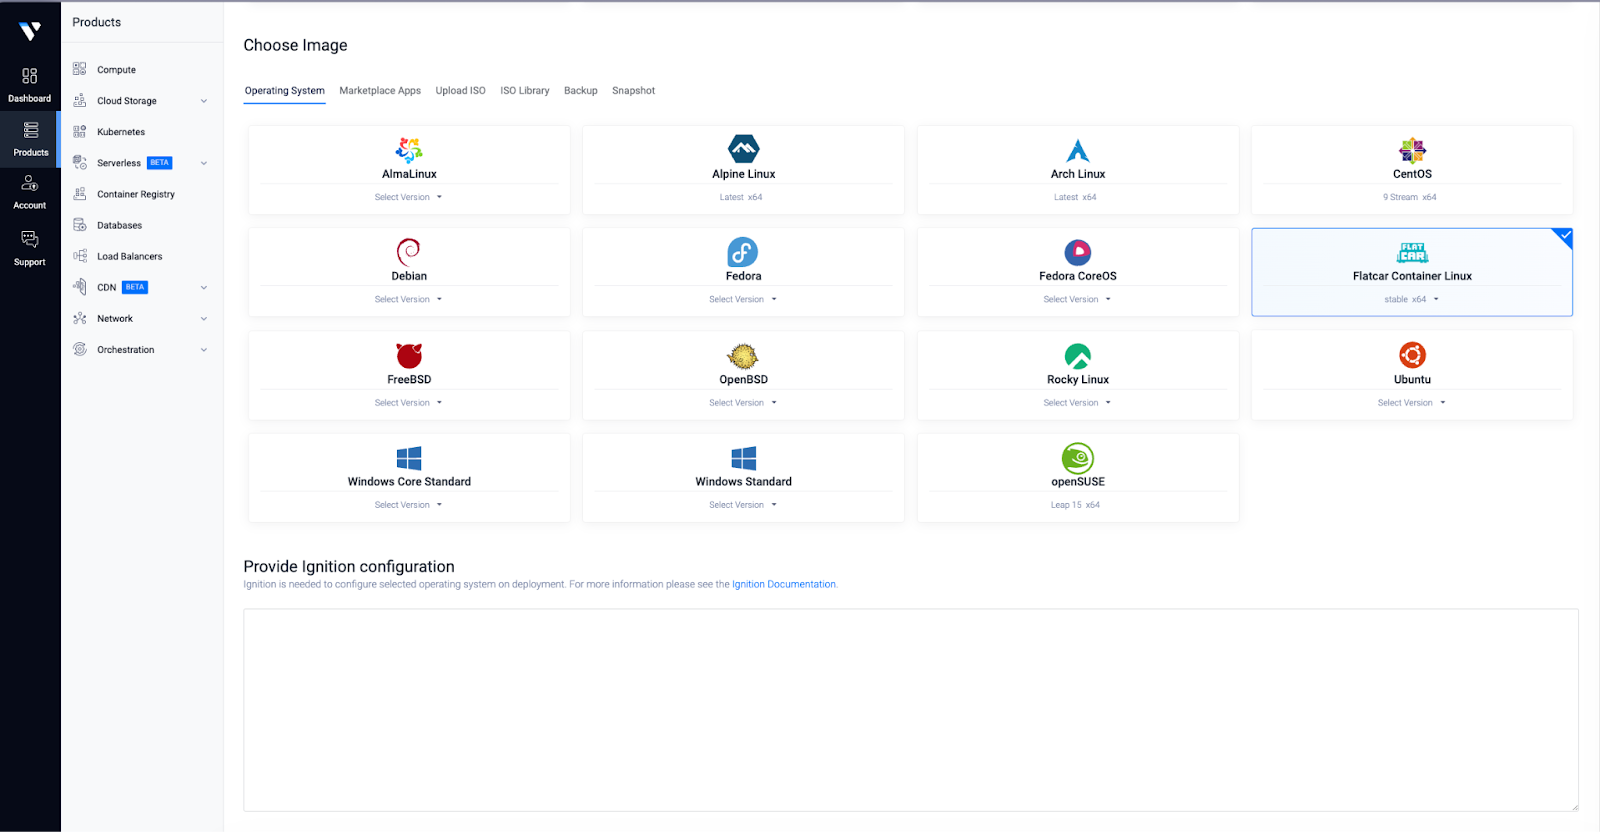
The UMH recommends deploying the stack as a Flatcar Linux image on a virtual machine managed by Proxmox. This process requires a separate computer that will act as a Proxmox server. Unfortunately, Todd didn’t have a spare machine lying around for his use case. Instead, he discovered that he could deploy the image on a virtual machine hosted by Vultr. It didn’t take him long to get the Flatcar Linux installation up and running. He was now ready to start working on the PackML use case.
As part of the installation, the UMH provides a so called PackML Simulator module. It implements the following PackML State model and communicates over MQTT topics as defined by environmental variables. This allows users to experiment with PackML data, as if they were modelling a machine. Todd set himself the objective to build a dashboard that visualizes the production information of the machine: its current state, the production speed and the amount of produced, consumed and scrapped goods.
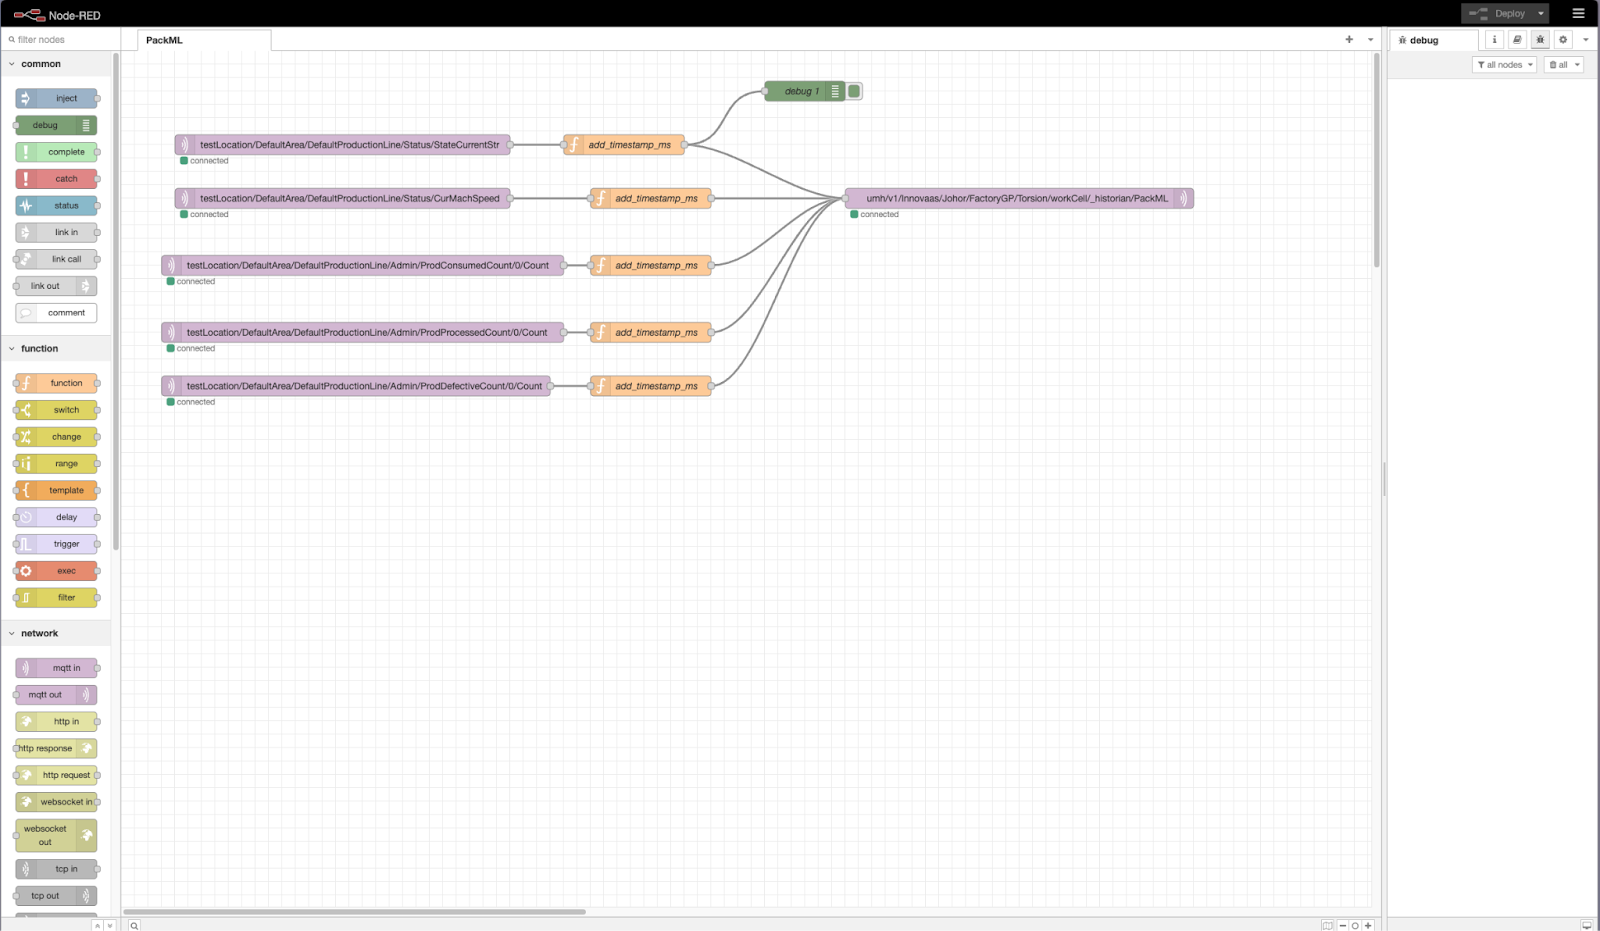
The first step of the phrases entails building a data pipeline to extract the data from the PackML Simulator, and transport it to the UMH’s Unified Namespace (UNS). For this purpose, the UMH supplies Node-RED which is an open-source technology to configure data flows in a graphical way by connecting nodes with arrows. The flow is shown in the image below. Todd configured 5 MQTT sources that transport their data to an MQTT sink after adding a timestamp. Going through the setup process and working with Node-Red was a great learning experience. “It’s very intuitive and very easy to build with” says Todd. Some people question its enterprise readiness for advanced use cases, but Todd notes that the UMH is overcoming this limitation by offering Benthos UMH in addition to Node-RED. This way, Node-RED can be used for prototyping before converting the flows to Benthos for large-scale, high-throughput data.
Once the MQTT data flows are configured in Node-RED, the data flows into the UNS. From there, specific topics are automatically transferred to the Historian by the UMH. Todd relied on the UMH Management Console’s Tag Browser to inspect the data, as shown in the image below. The Tag Browser shows the latest real-time values of a particular tag, for example the current machine speed.
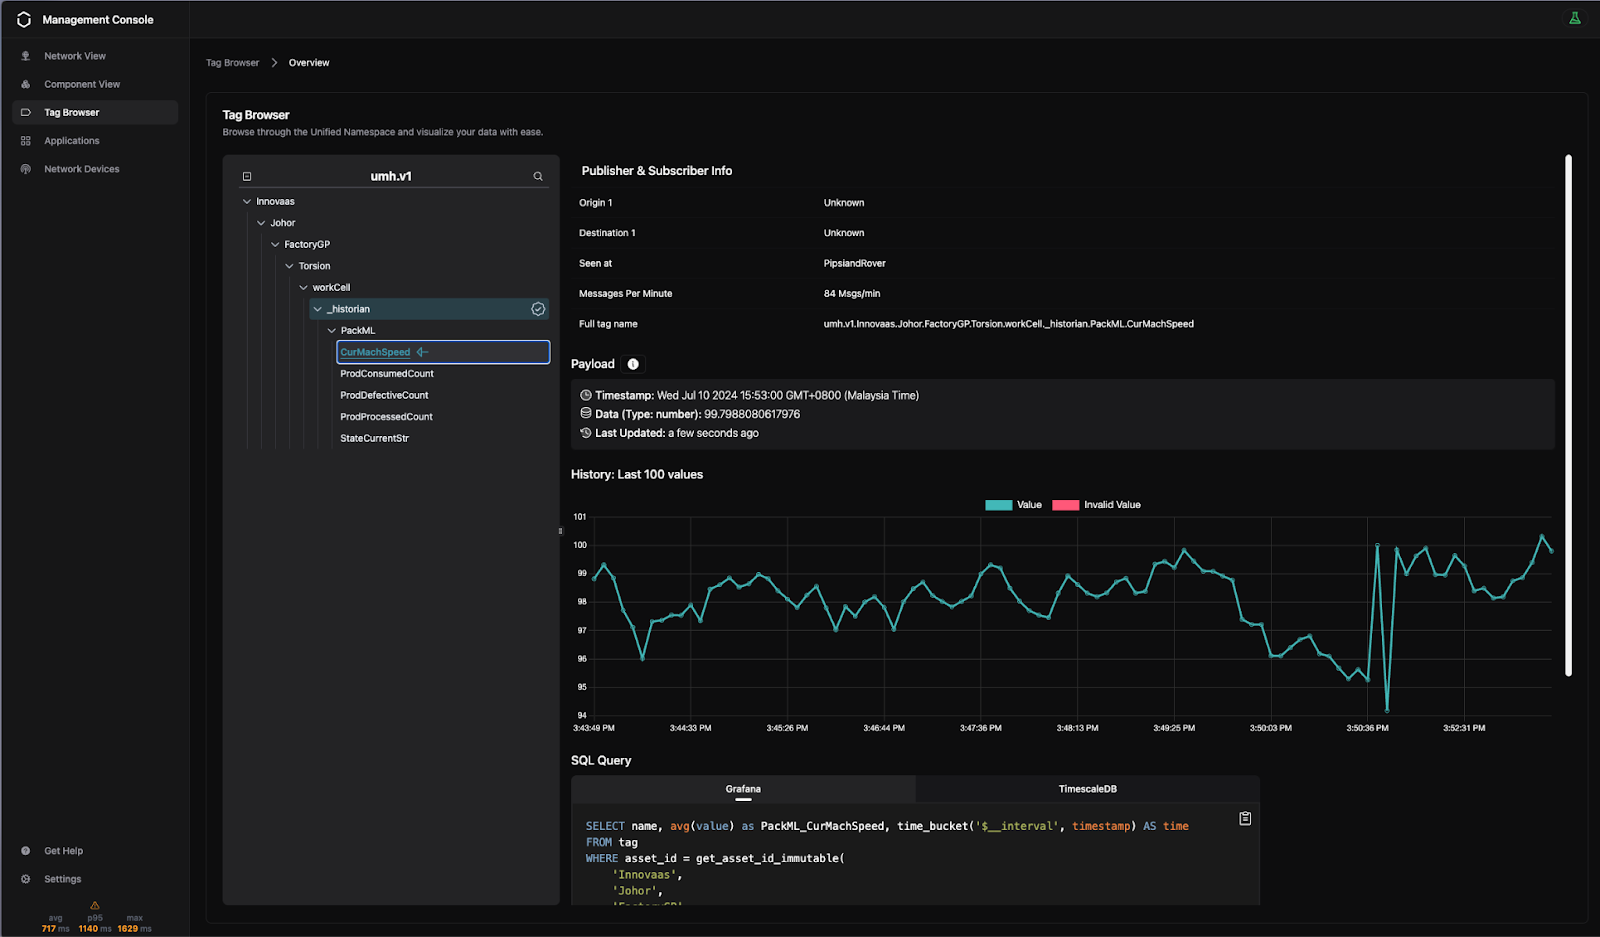
Once the data is stored in the Historian, it can be easily visualized in Grafana that comes as part of the UMH stack. The UMH provides a pre-configured data model that allows the user to directly visualize the data in Grafana by copy-pasting the SQL query generated by the Tag Browser. This seamless integration between the Historian and Grafana makes building dashboards significantly faster.
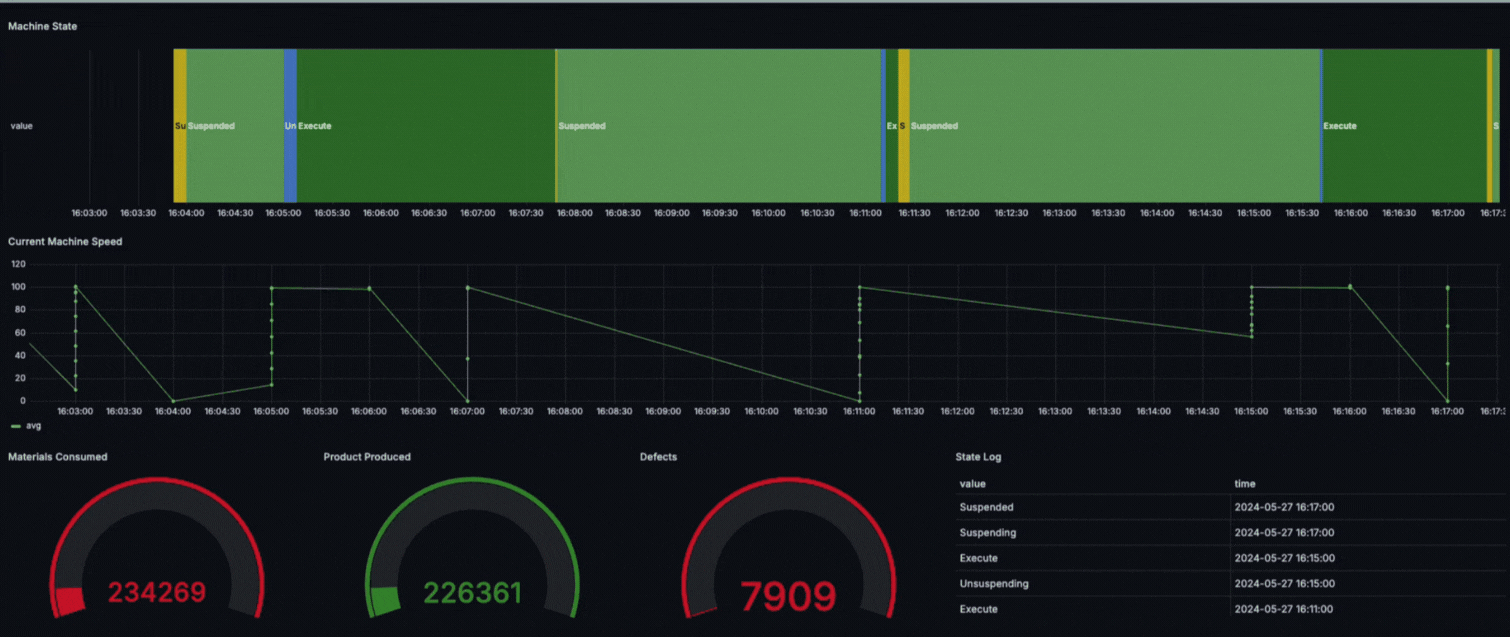
For the dashboard, Todd decided to display the machine state in a diagram at the very top. Below the state diagram, Todd aligned the current machine speed. In periods where the machine is not running, it’s seen that the current machine speed is zero. Finally, Todd added three widgets that show the number of produced, consumed and scrapped parts. The dashboard gives a clear insight in the performance of the machine.
This project of developing an end-to-end solution using nearly all the components of the UMH stack has been a great learning journey, according to Todd. The fact that the UMH abstracts away so much of the underlying complexity is, however, a double-edged sword: on the one hand, it allows you to deliver value quickly. On the other hand, clients want to understand how the delivered solution works in detail. This is why Todd spent additional time digging deep into the workings of the UMH to figure out its architecture. Todd is really excited about the role of the UMH in enabling Digital Transformation and the democratization of data across the manufacturing enterprise.
If you want to build similar dashboards, you can try our free community version here.


