
In this tutorial, Denis guide you through the process of building a Grafana dashboard based on the PackML model with Node-RED and the UMH.
We begin with a look at the PackML MQTT simulator , developed by Amine Amaach, which simulates a real production line using the PackML standard and integrates with MQTT for messaging. Following this, we build a dashboard that can display various machine states (such as Starting, Running, Stopped, etc.), operational metrics, and alarms or notifications. In addition, we'll cover how to use the management console and explain how to work with the overall data model.
Interested in specific part of the video? Here are the chapters:
00:00 - 00:27 Introduction
00:27 - 02:44 What is PackML MQTT Simulator
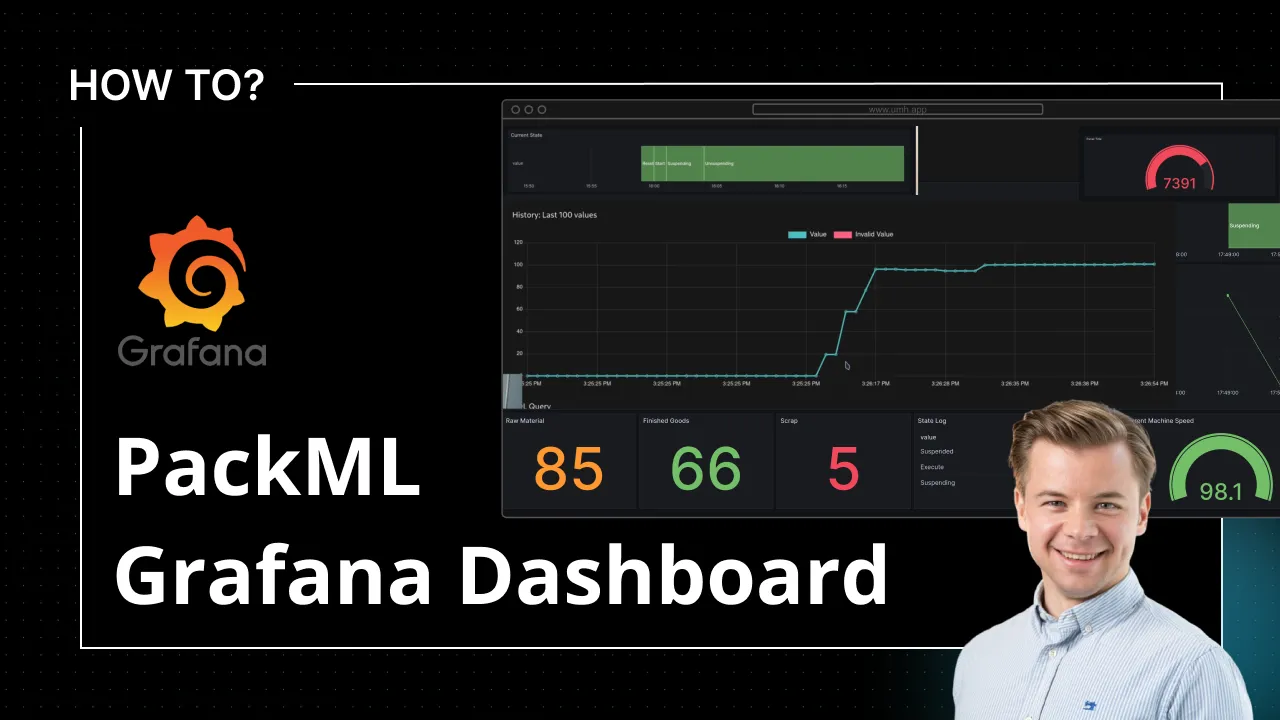
02:44 - 06:16 How a final dashboard looks like?
06:16 - 06:51 Workflow overview
06:51 - 08:55 Getting started with the MQTT Explorer
08:55 - 15:25 Defining a flow in Node-RED
15:25 - 16:44 Verify the tag in the Management Console Tag Browser
16:44 - 19:05 Build the Grafana dashboard panel
19:05 - 22:56 Repeat the entire workflow for a second tag
22:56 - 23:40 Suspend the PackML machine


