


Imagine you are sitting in a meeting while a machine is having a failure and is standing still. Wouldn’t it be useful to directly receive an alert to learn about a problem in the moment they occur? Also, wouldn’t it be beneficial to not always need to check the production dashboard but receive notifications on your personal computer or phone instead?
This is possible by simply connecting your Grafana dashboard with Microsoft Teams, the communication tool most companies probably use every day.
The following steps show how to set up real-time alerts in a few simple steps.
You start with the configuration in Teams:
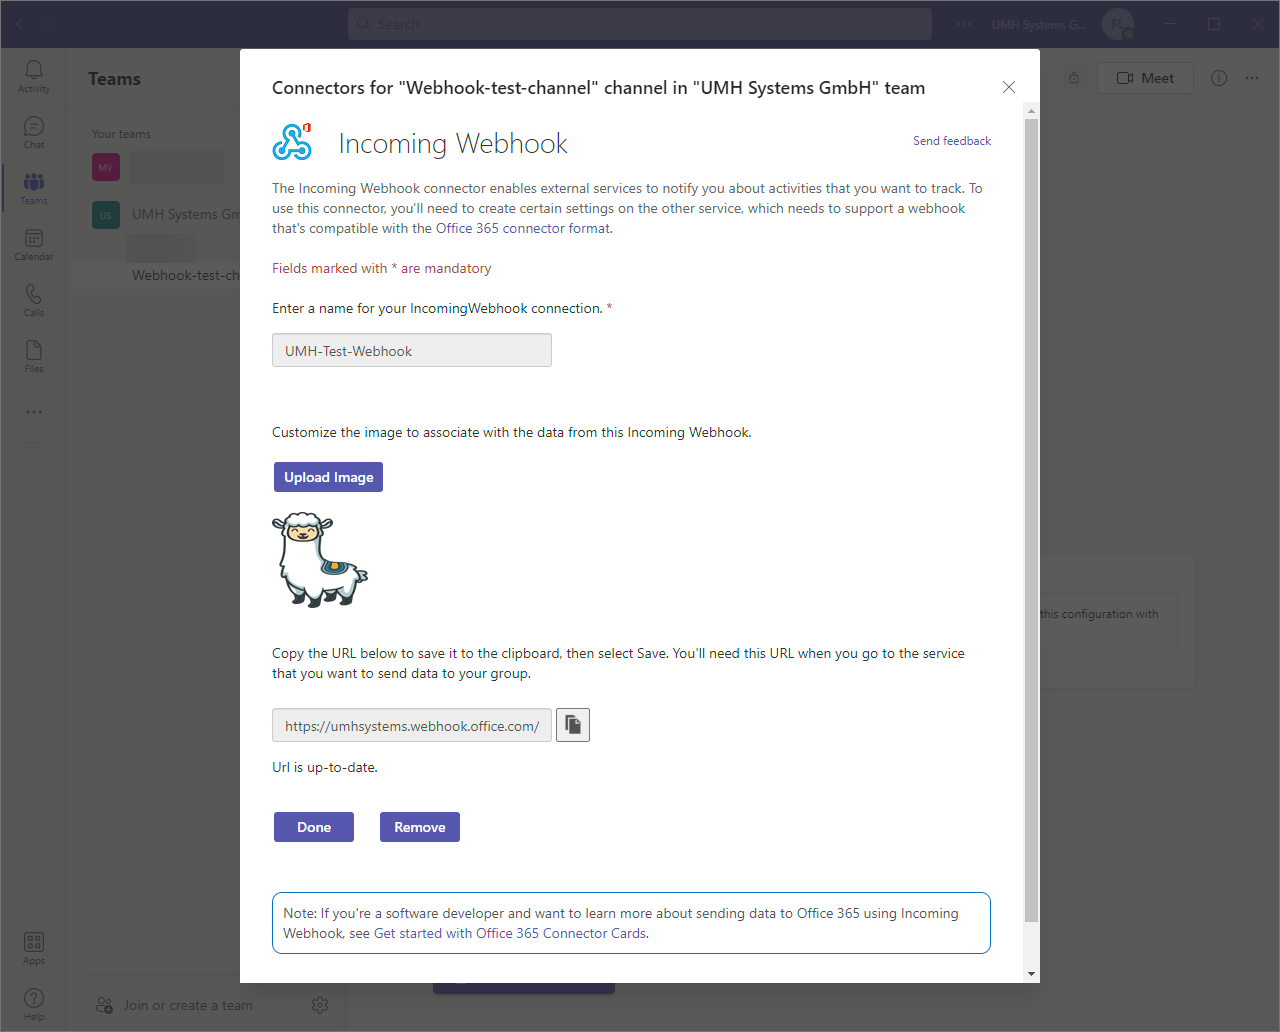
- First you need to create a new Webhook in the channel you want to receive the alarms. A Webhook is a tool that allows external applications to share contents with Teams.
- To do so, click on the small arrow next to the preferred channel and then click on the three dots next to the new subitem on the left side. Then select Connectors.
- In the upcoming menu, select Incoming Webhook as a Connector, then click on the button that says Add.
- In a new menu, you can choose a name and icon for the new Webhook, then click on Create. After clicking on Create, you will get a unique URL with the Incoming Webhook, that is the URL you want to use in Grafana.
Now switch to Grafana:
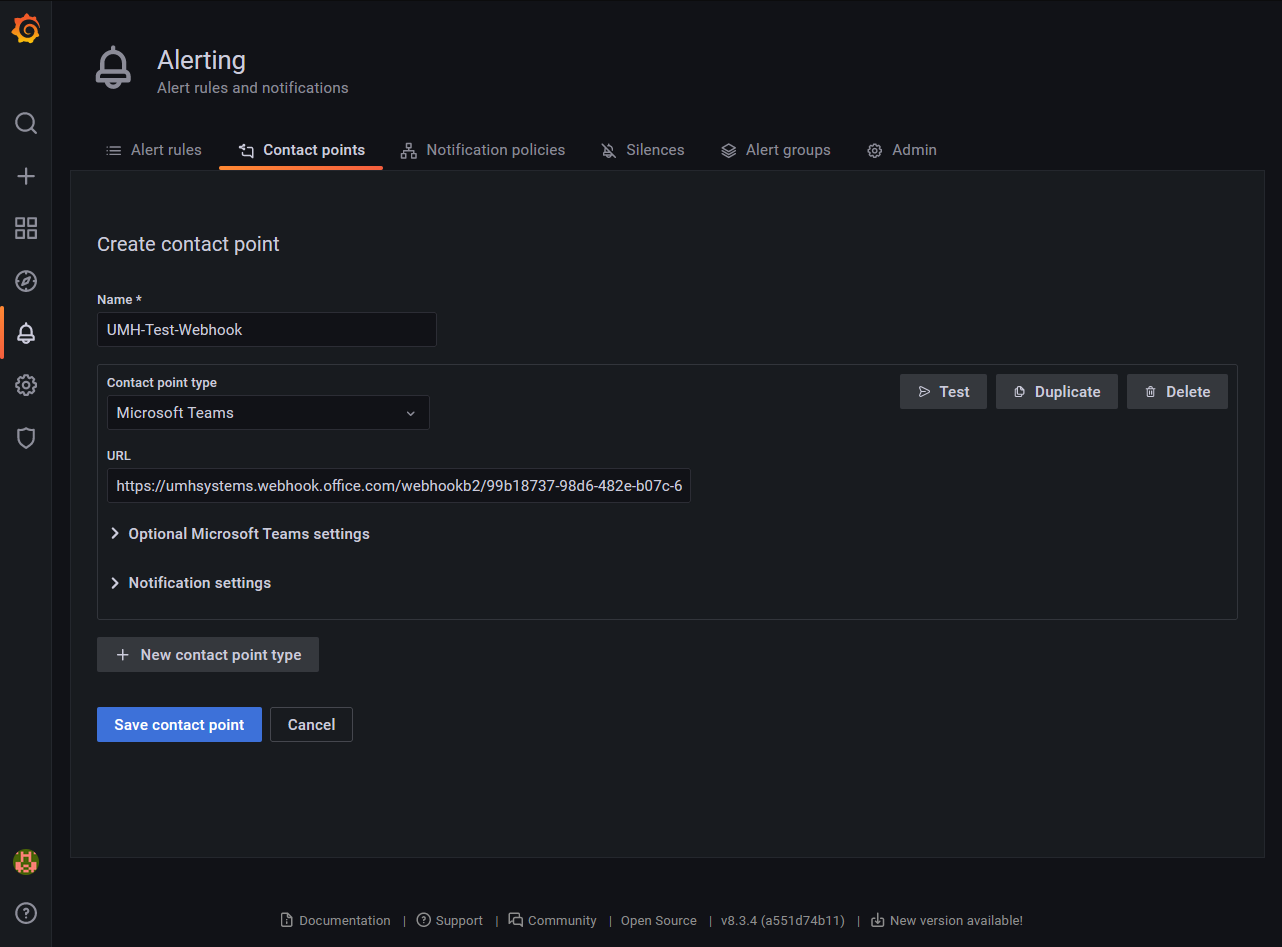
- In the menu on the left side, click Alerting, then Contact points and New contact point.
- In the menu for the new notification channel, you can assign a name that you like and personalize what you want to get as notifications, for example images or reminders. Don’t forget to paste your unique Teams URL under Teams settings!
3. Now you can perform a test run and will get an alert of test notification on Teams. On Teams, the alerts are marked by [Alerting].
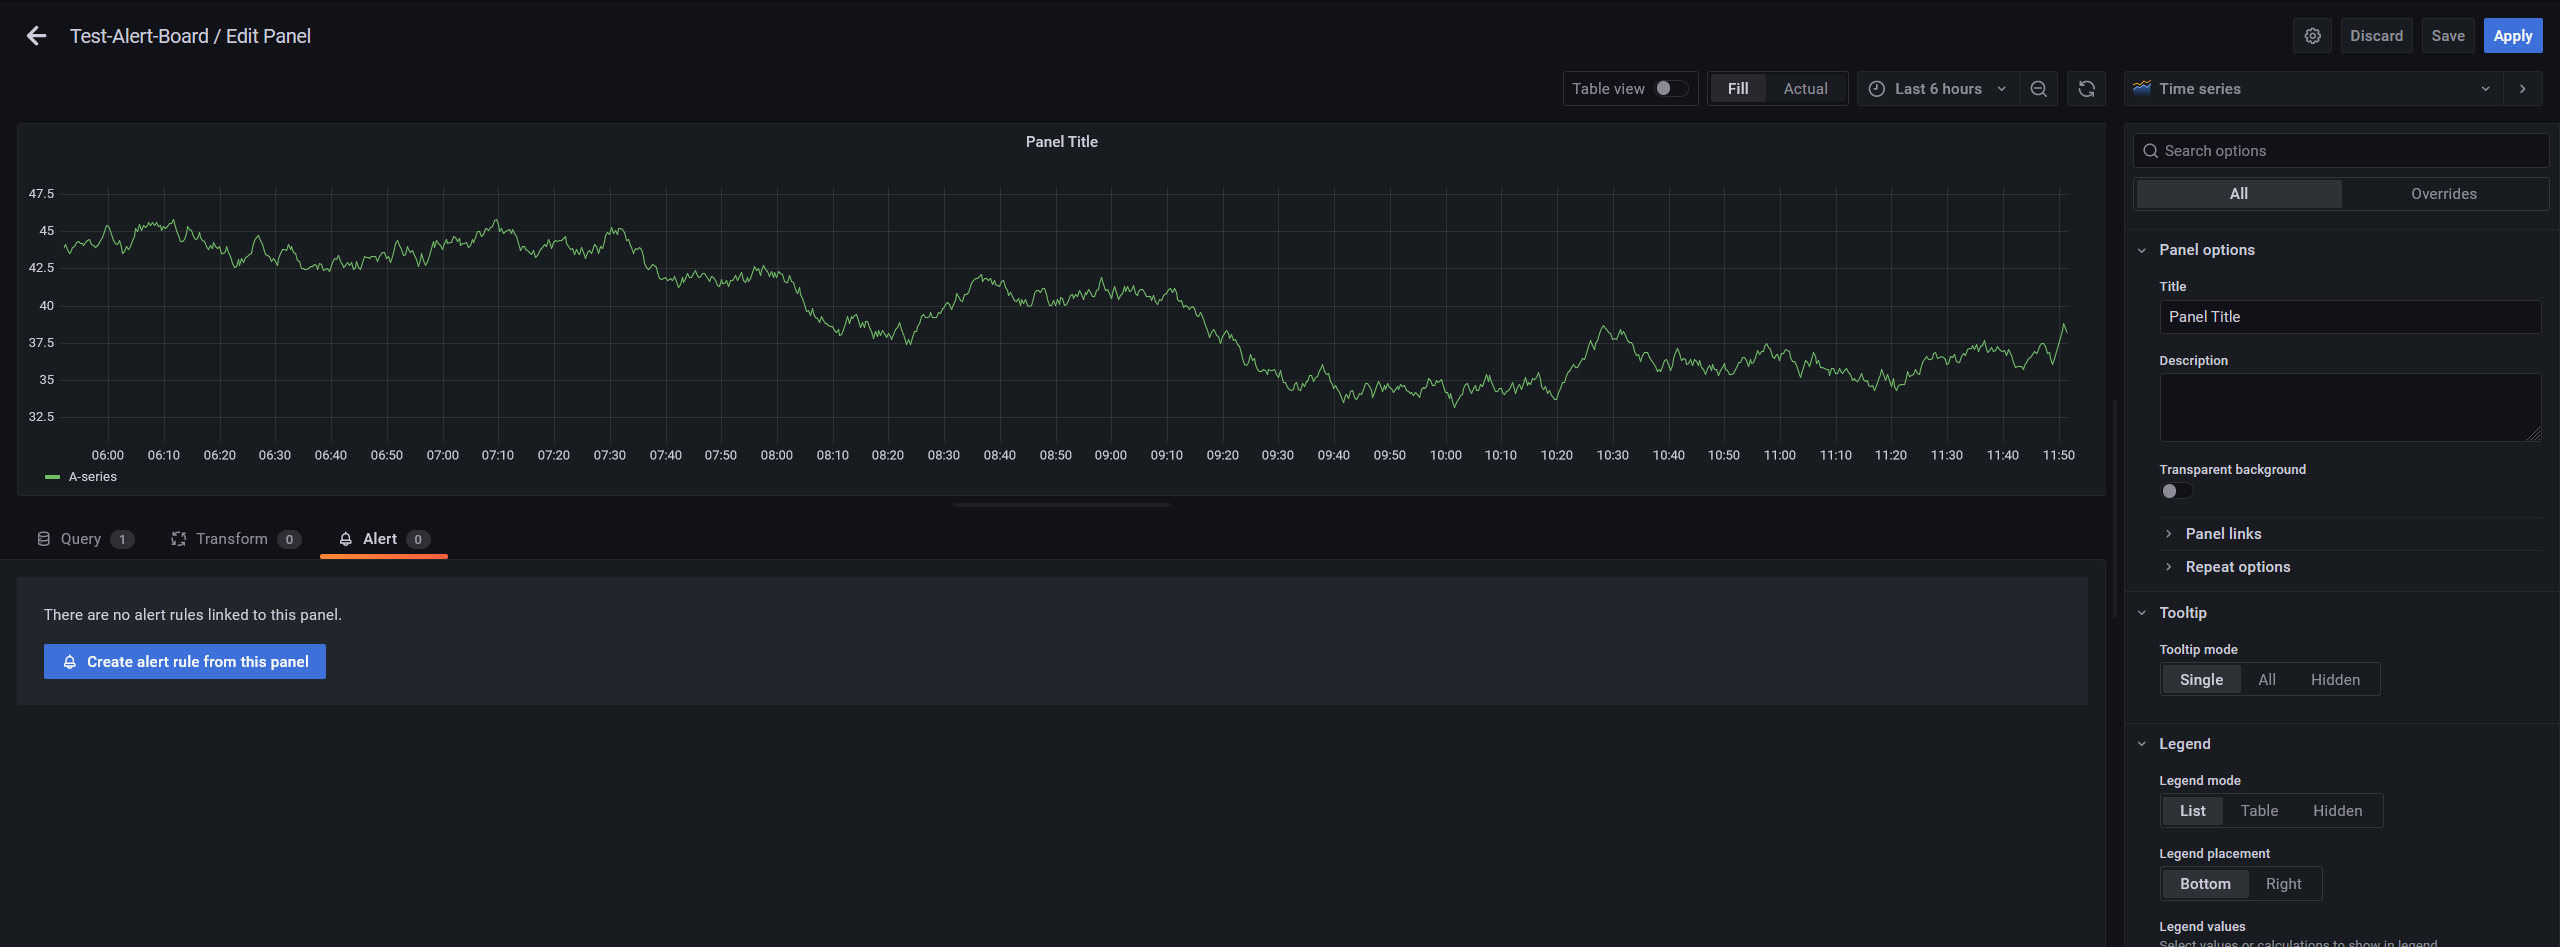
4. On the Grafana dashboard, you will now have to select the graph which values you want to monitor with thresholds. Therefore, click on Edit next to the graph. Important: you will not be allowed to get notifications from all metrics, but it works for all the graphs.
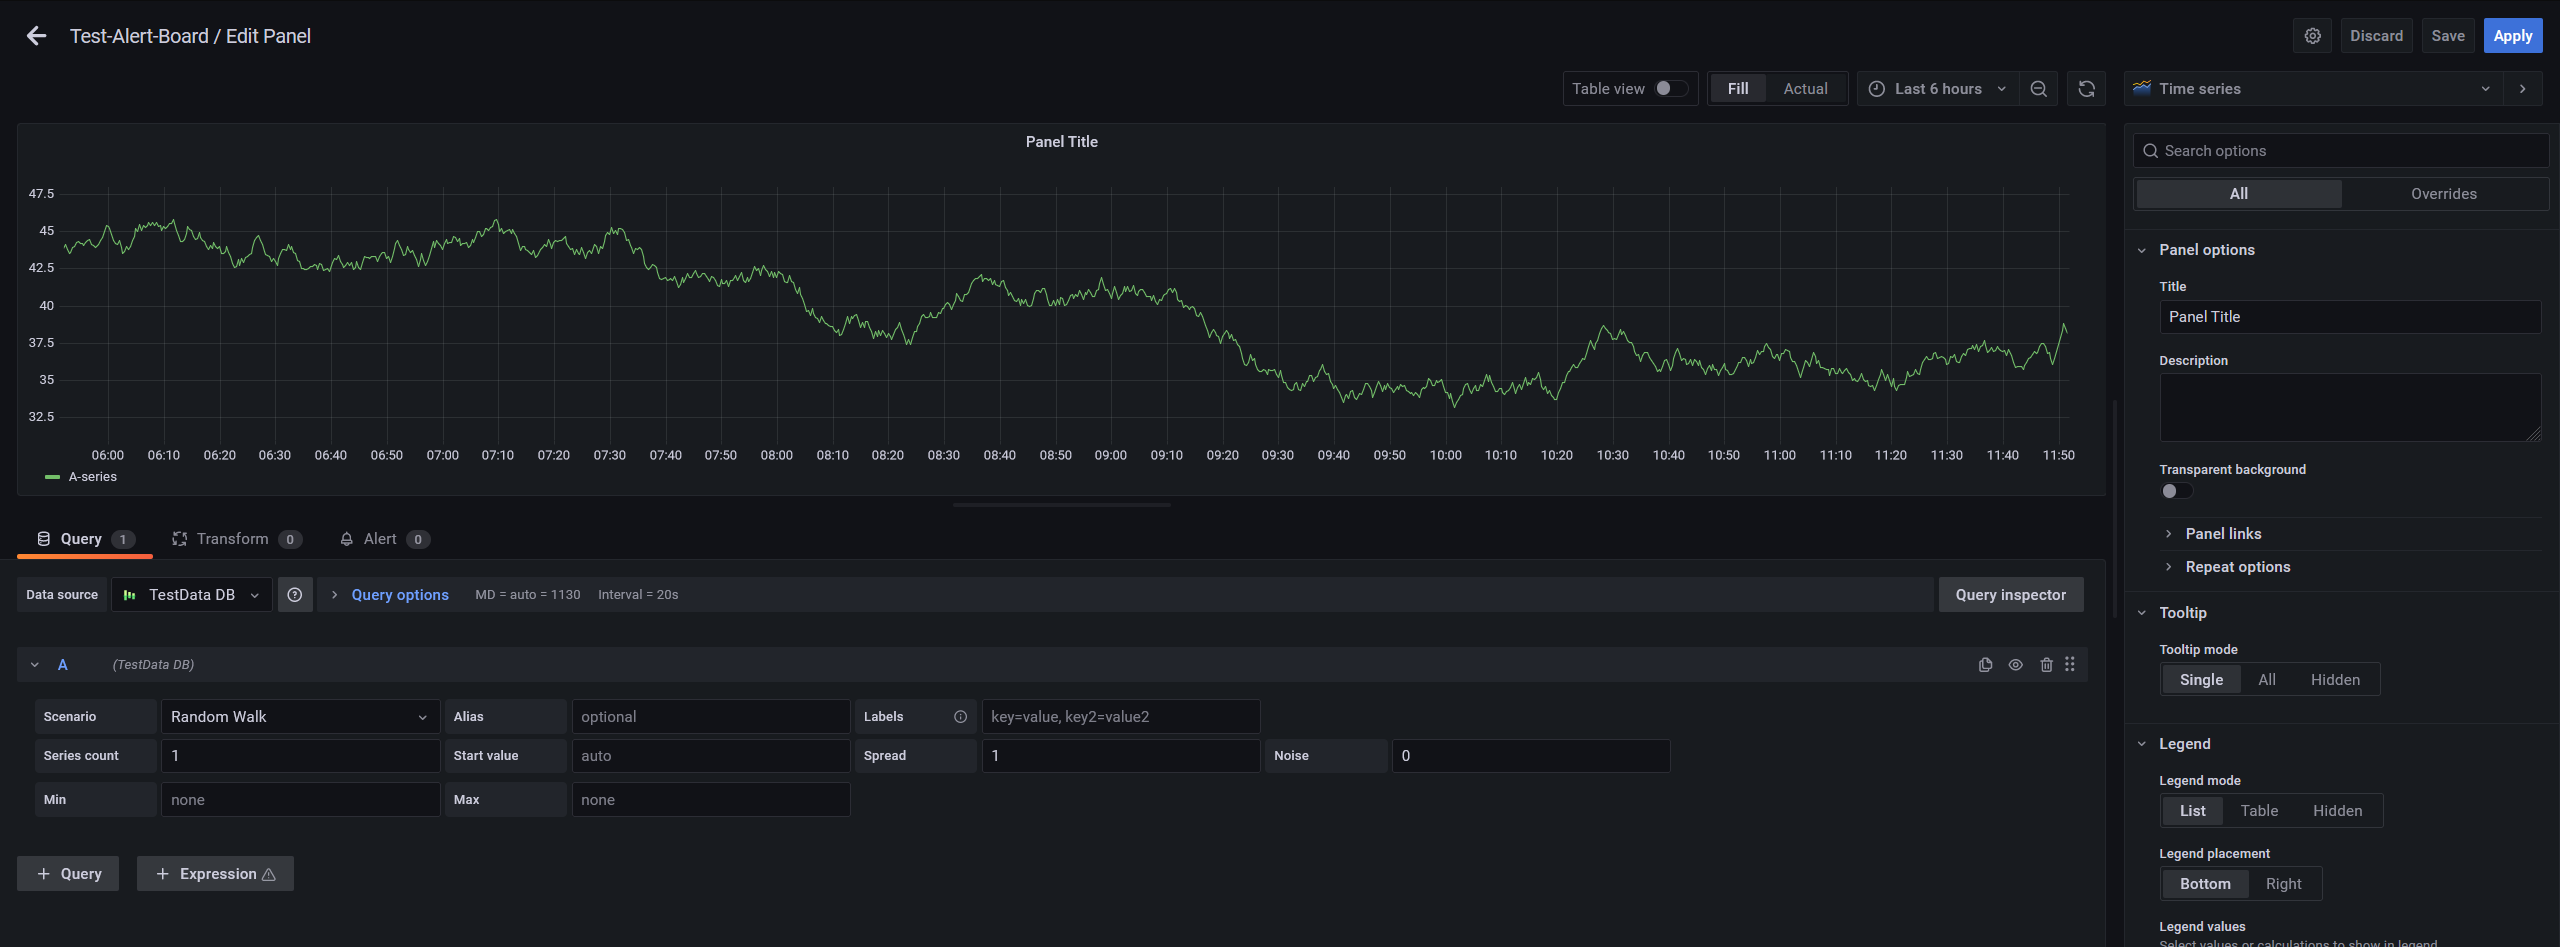
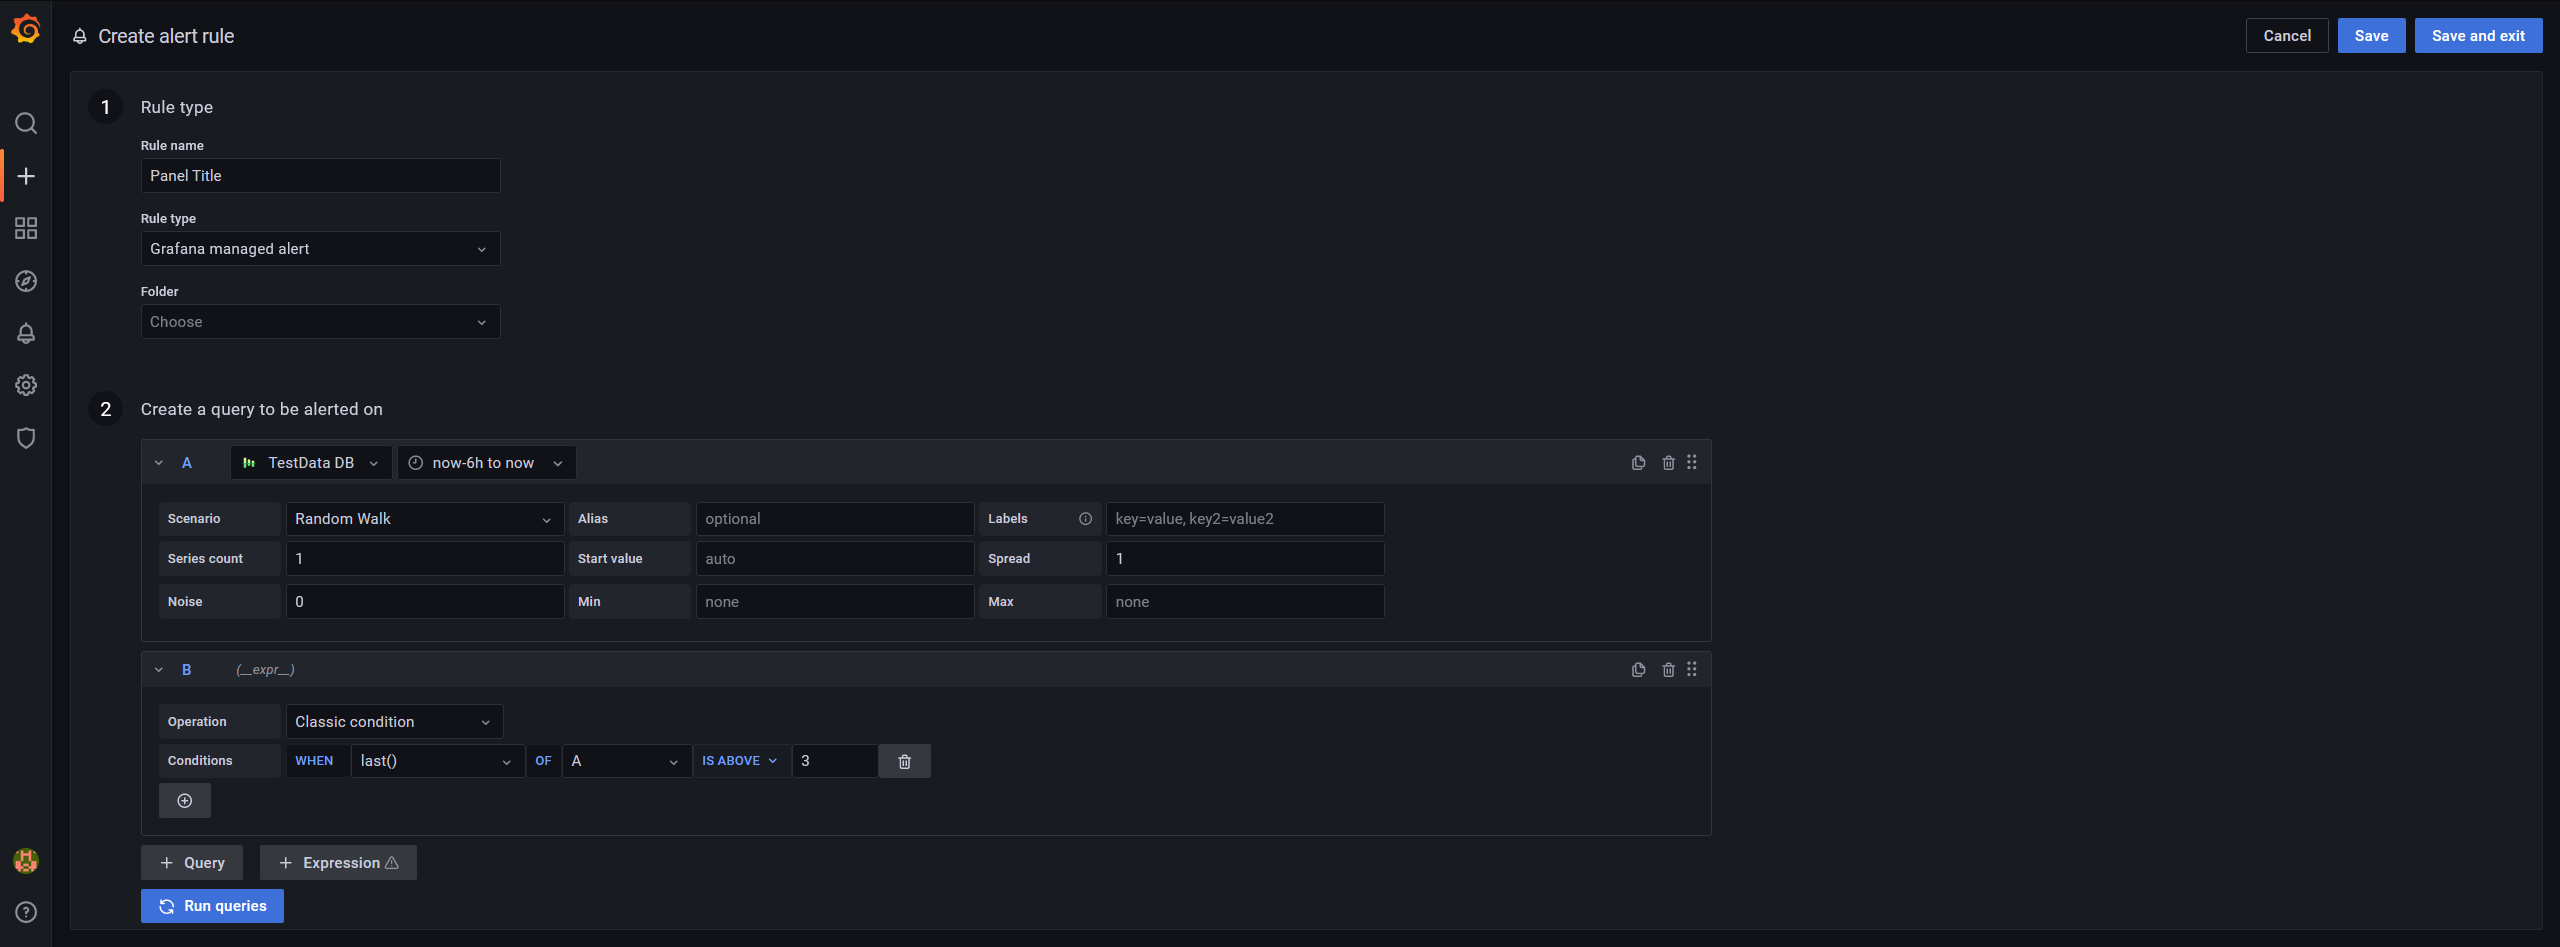
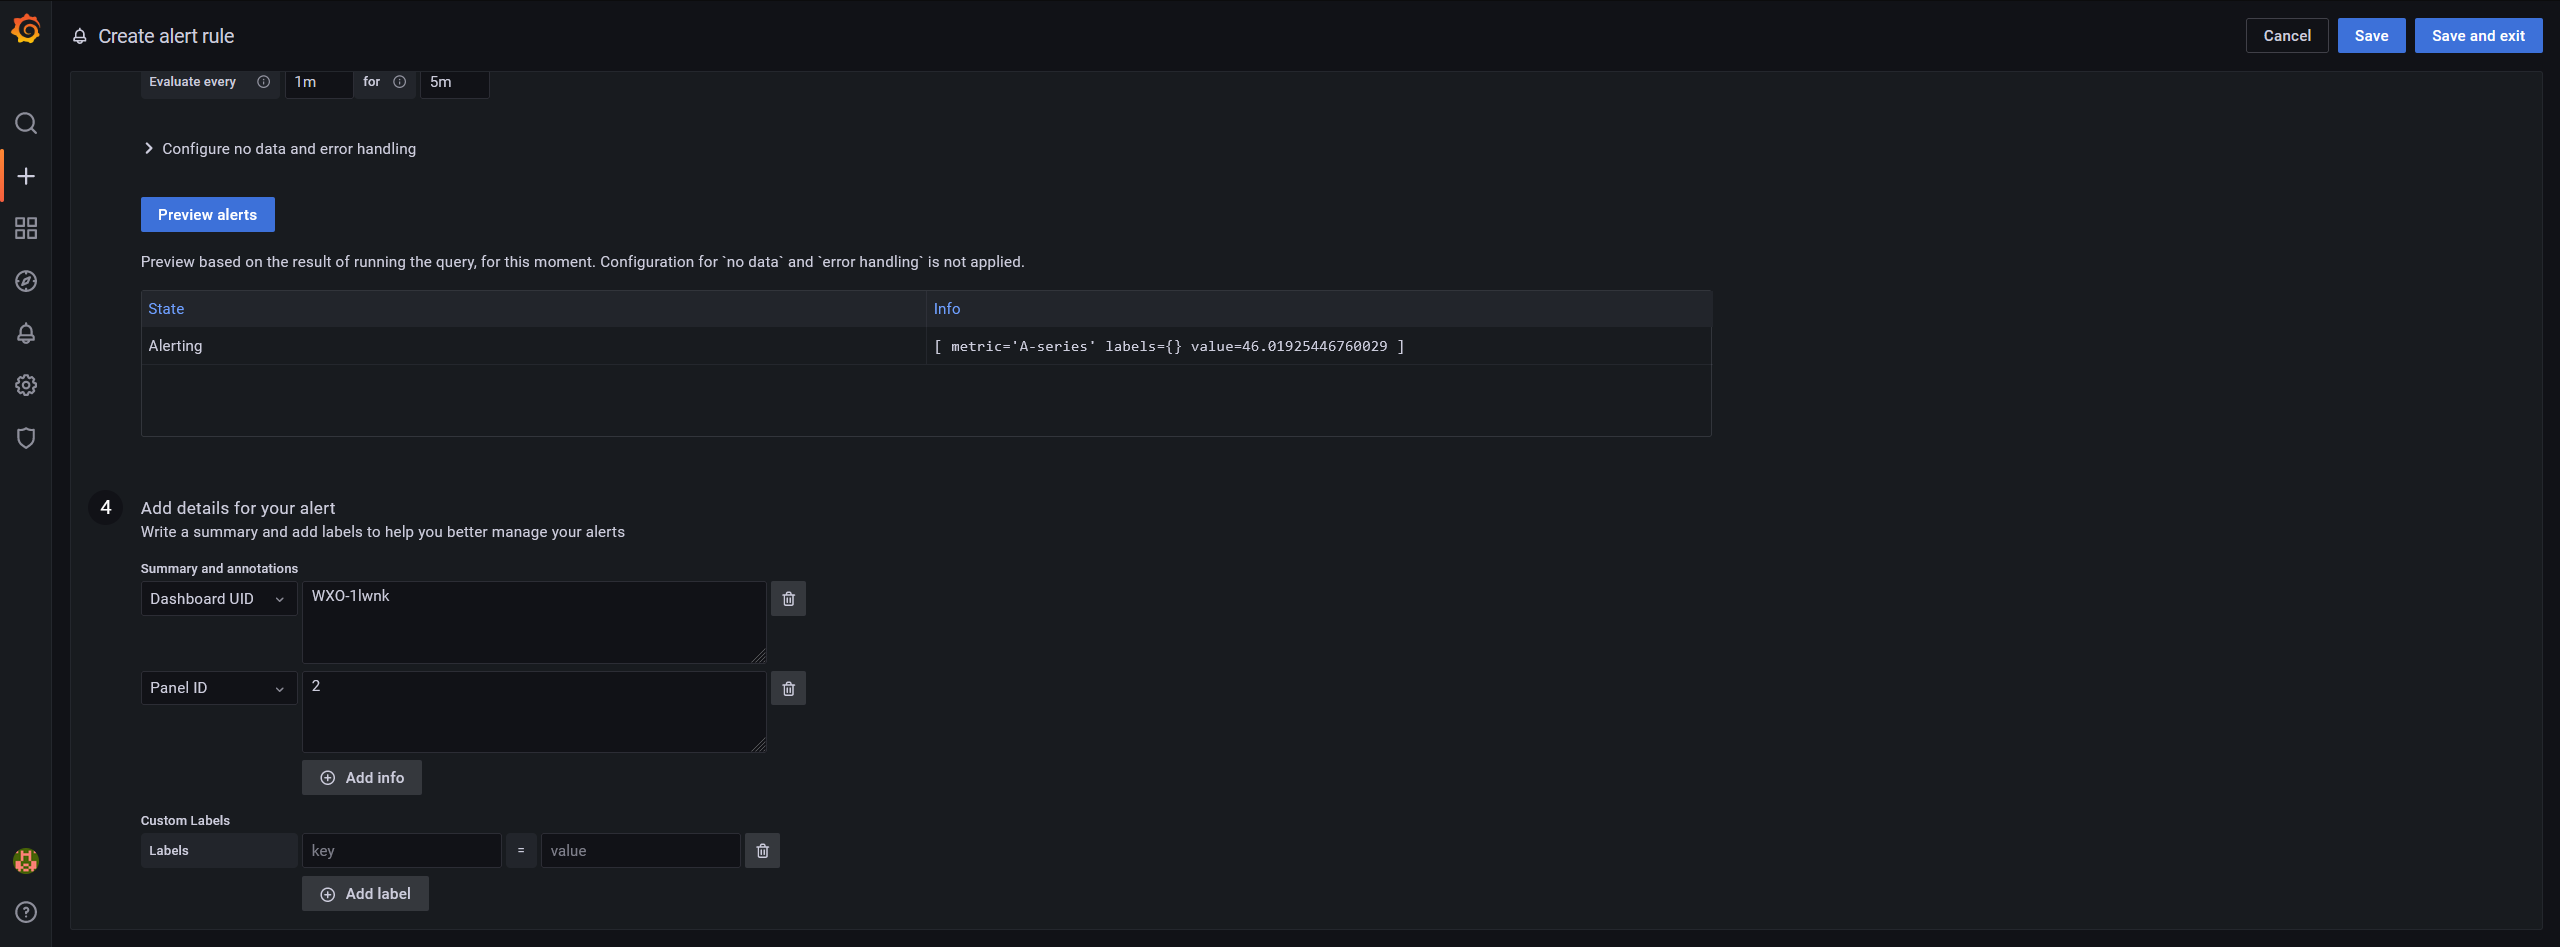
5. In the menu of creating a new alert rule you can introduce the thresholds that you need. You can also choose the number of minutes that it has to happen to give an alarm.
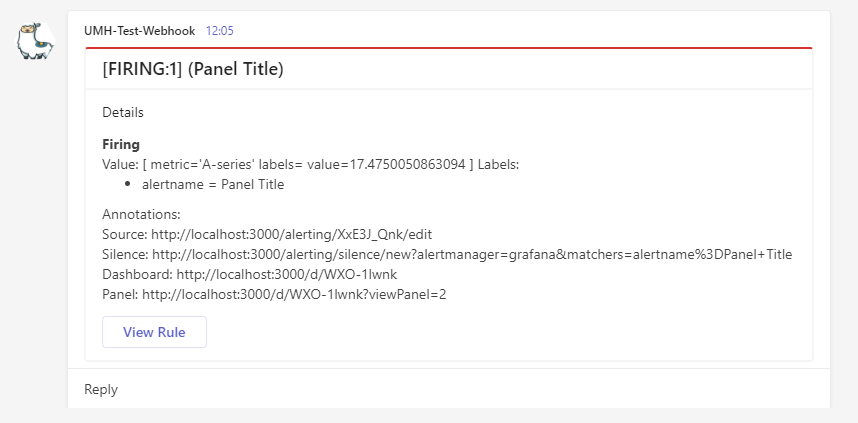
6. In the last step, you will see the notifications that you will get on Teams. Now, if the threshold you set is exceeded, you will get an alert on Teams that looks like this:
Done! We hope that this new feature will help you and your productivity.
If you want to know more about our Open-Source Software, have a look at our United Manufacturing Hub on GitHub.
To learn more about the project, have a look at our documentation docs.umh.app/docs.


