


The United Manufacturing Hub utilizes a TimeScaleDB database, which is based on PostgreSQL. With Grafana, you can create alert rules and connections to the desired contacts and services to set of notifications based on real time data.
Instructions
As an example, this tutorial will use the simulated OPC-UA data from this tutorial. It is necessary to follow the OPC-UA tutorial, if you wish to use the same values as in the following examples.
Important Expressions
- Alert rule: Define the event and its duration that should trigger the
alert. - Contact point: Define contacts and used services that should be notified.
- Notification policy: Link contact points to alert rules.
- Label: Labels are tags for the alerts. For example different teams, factories, production lines or priorities.
- Mute time and Silence: You can mute an alert on a regular basis or a singular, planned time frame (for example maintenance).
Installation and SetUp
- Install the PostgreSQL plugin in Grafana
Before you can formulate alerts, you need to install the PostgreSQL plugin, which is already integrated into Grafana. Here is a short summary of how to to it, for a more detailed tutorial, take a look at our tutorial on how to access the database.
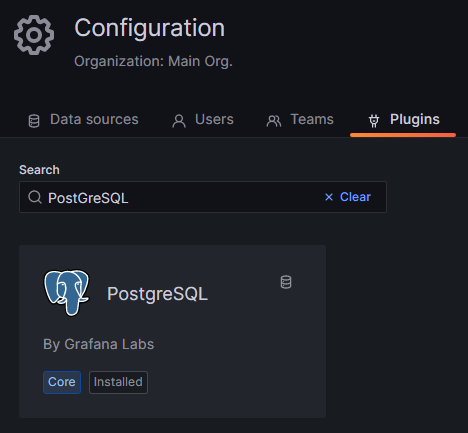
- Hover over the Configuration button in the bottom left corner and click on Data sources.
- Click on Plugins, search for PostgreSQL and then install the plugin.
Add an alert rule
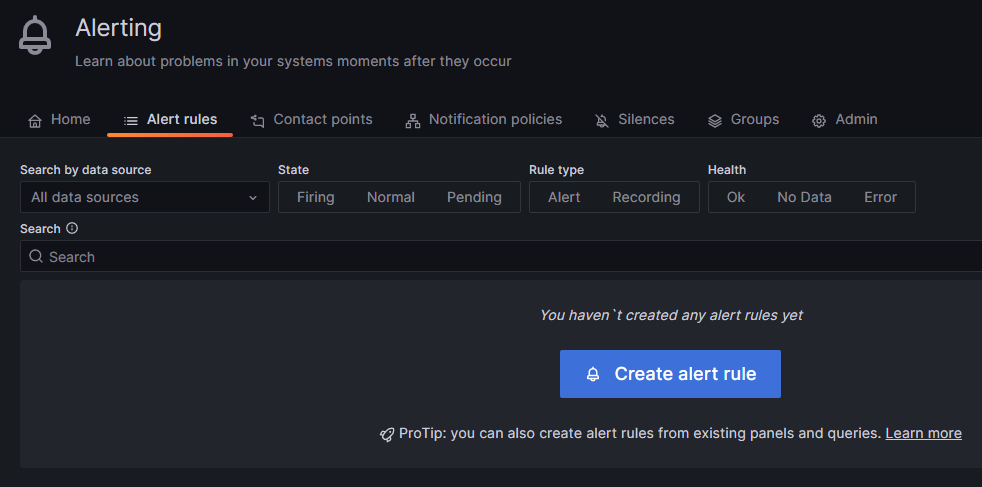
The first thing to do is create the alert rule itself, which specifies the event after which Grafana should trigger an alert. To add a new rule, hover over the bell symbol on the left and click on Alert rules. Then click on the blue Create alert rule button.
- First, you must choose a name for your rule.
- In the second section, you need to select and manipulate the value that triggers your alert and declare the function for the alert.
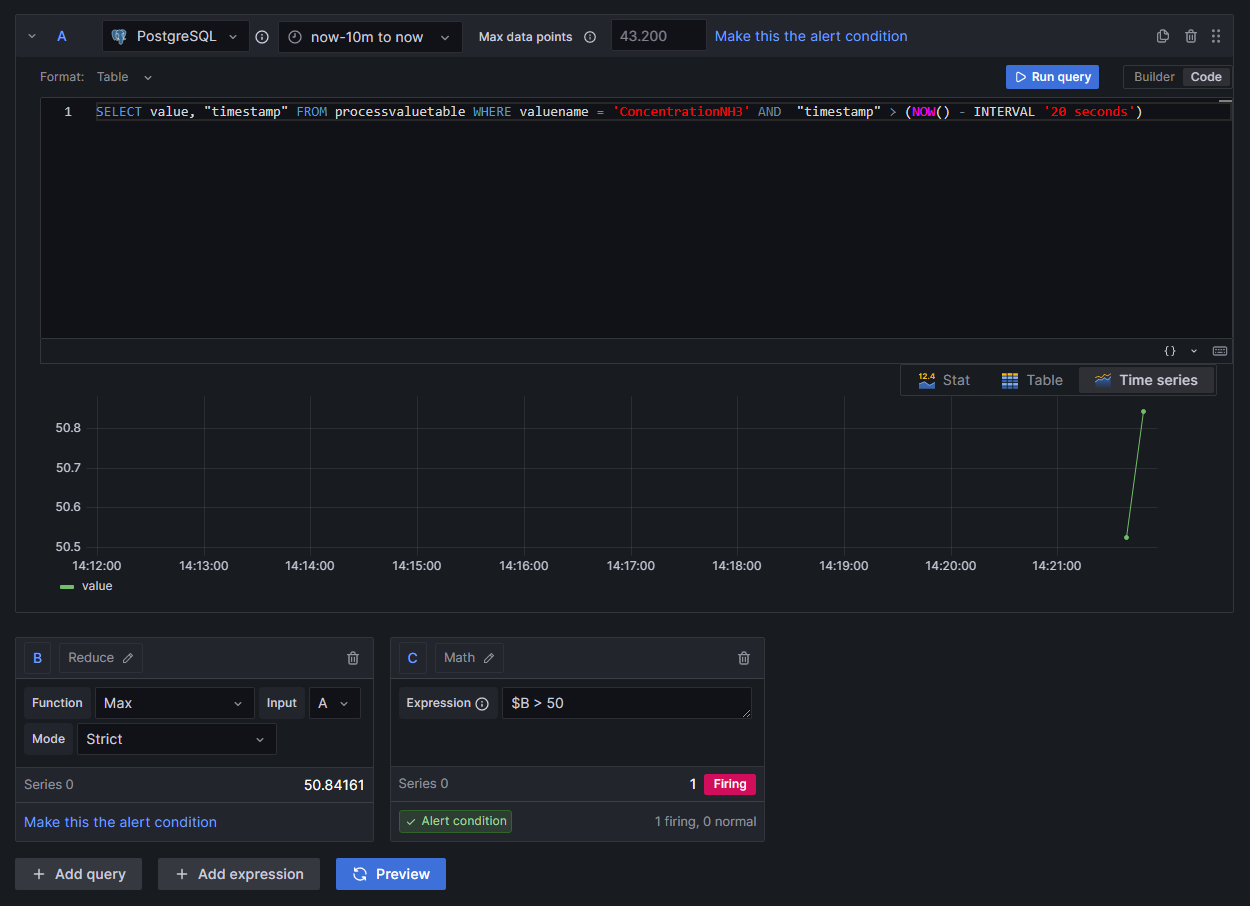
- Subsection A is, by default the selection of your values: You can use the Grafana builder for this, but it is not useful, as it cannot select a time interval even though there is a selector for it. If you choose, for example, the last 20 seconds, your query will select values from hours ago. Therefore, it is necessary to use SQL directly. To add command manually, switch to Code in the right corner of the section.
- First, you must select the value you want to create an alert for. In the United Manufacturing Hub's data structure, a process value is stored in the table processvaluetable under the column value. Unfortunately Grafana cannot differentiate between different values of the same sensor; if you select the ConcentrationNH3 value from the example and more than one of the selected values violates your rule in the selected time interval, it will trigger multiple alerts. Because Grafana is not able to tell the alerts apart, this results in errors. To solve this, you need to add the value "timestamp" to the
Selectpart. So the first part of the SQL command is:SELECT value, "timestamp". - The source is processvaluetable, so add
FROM processvaluetableat the end. - The different values are distinguished by the variable valuename in the processvaluetable, so add
WHERE valuename = 'Name you chose in NodeRed'to select only the value you need. If you followed the tutorial linked above, you can use ConcentrationNH3 as the name. - Since the selection of the time interval in Grafana is not working, you must add this manually as an addition to the
WHEREcommand:AND "timestamp" > (NOW() - INTERVAL 'X seconds'). X is the number of past seconds you want to query. It's not useful to set X to less than 10 seconds, as this is the fastest interval Grafana can check your rule, and you might miss values.
- First, you must select the value you want to create an alert for. In the United Manufacturing Hub's data structure, a process value is stored in the table processvaluetable under the column value. Unfortunately Grafana cannot differentiate between different values of the same sensor; if you select the ConcentrationNH3 value from the example and more than one of the selected values violates your rule in the selected time interval, it will trigger multiple alerts. Because Grafana is not able to tell the alerts apart, this results in errors. To solve this, you need to add the value "timestamp" to the
The complete command is:
SELECT value, "timestamp" FROM processvaluetable WHERE valuename = 'ConcentrationNH3' AND "timestamp" > (NOW() - INTERVAL '10 seconds')
-
In subsection B, you need to reduce the values to numbers, Grafana can work with. By default, Reduce will already be selected. However, you can change it to a different option by clicking the pencil icon next to the letter B. For this example, we will create an upper limit. So selecting Max as the Function is the best choice. Set Input as A (the output of the first section) and choose Strict for the Mode. So subsection B will output the maximum value the query in A selects as a single number.
-
In subsection C, you can establish the rule. If you select Math, you can utilize expressions like
$B > 50to trigger an alert when a value from section B ($B means the output from section B) exceeds 50. In this case, only the largest value selected in A is passed through the reduce function from B to C. A simpler way to set such a limit is by choosing Threshold instead of Math.
To add more queries or expressions, find the buttons at the end of section two and click on the desired option. You can also preview the results of your queries and functions by clicking on Preview and check if they function correctly and fire an alert.
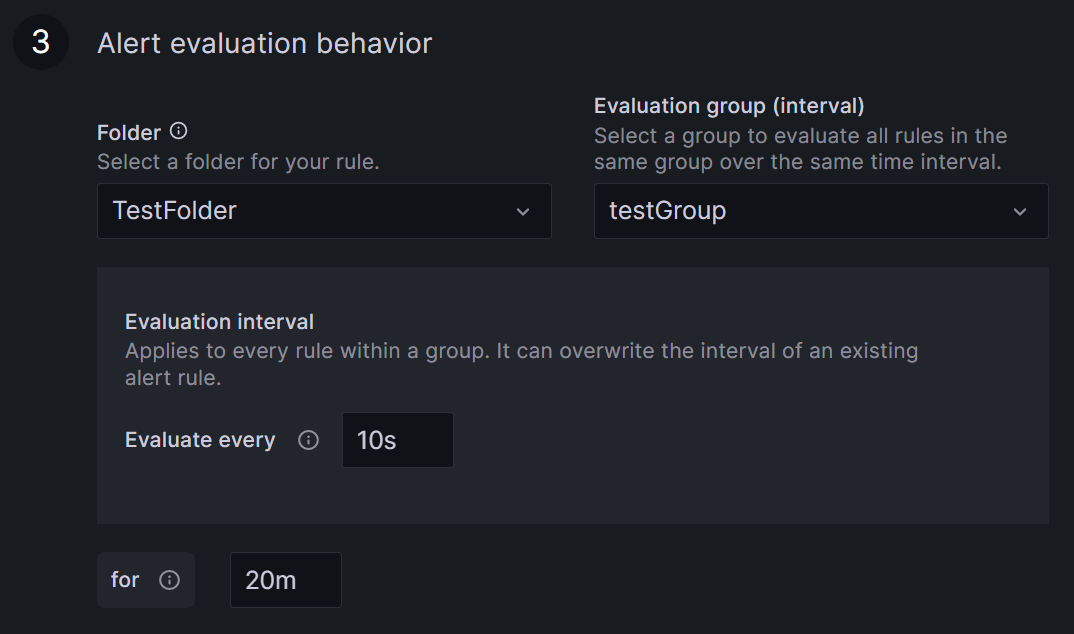
- Section three defines the rule location, the time interval for rule checking, and the duration for which the rule has to be broken before an alert is triggered.
- Select a name for your rule's folder or add it to an existing one by clicking the arrow. Find all your rules grouped in these folders on the Alert rules page under Alerting.
- An Evaluation group is a grouping of rules, which are checked after the same time interval. Creating a new group requires setting a time interval for rule checking. The minimum interval from Grafana is ten seconds.
- Specify the duration the rule must be violated before triggering the alert. For example, with a ten-second check interval and a 20-second duration, the rule must be broken twice in a row before an alert is fired.
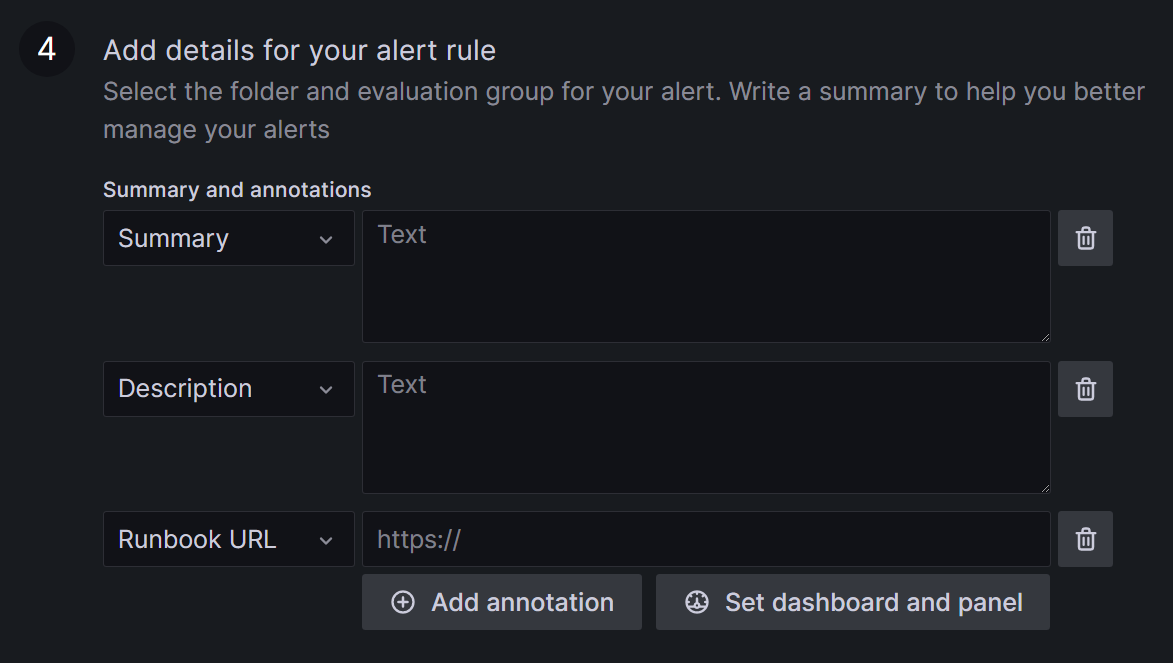
- In section four, you can add details and descriptions for your rule.
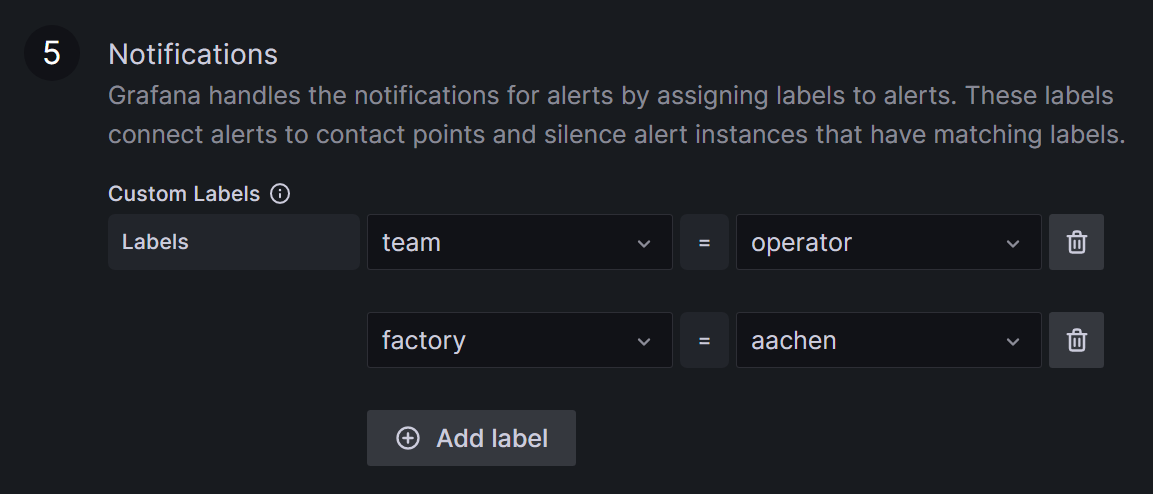
- In section five, you are required to assign labels to your alert, ensuring it is directed to the appropriate contacts. For example, you may designate a label team with alertrule1:
team = operatorand alertrule2:team = management. It can be helpful to use labels more than once, like alertrule3:team = operator, to link multiple alerts to a contact point at once.
Your rule is now completed; click on Save and Exit on the right upper
corner, next to section one.
Create a Contact Point
A contact point consolidates addresses and services to be notified. When a linked alert is triggered, everyone within the contact point receives a message. To create a contact point, navigate to Contact points, located at the top of the Grafana alerting page.
- Click on the blue + Add contact point button.
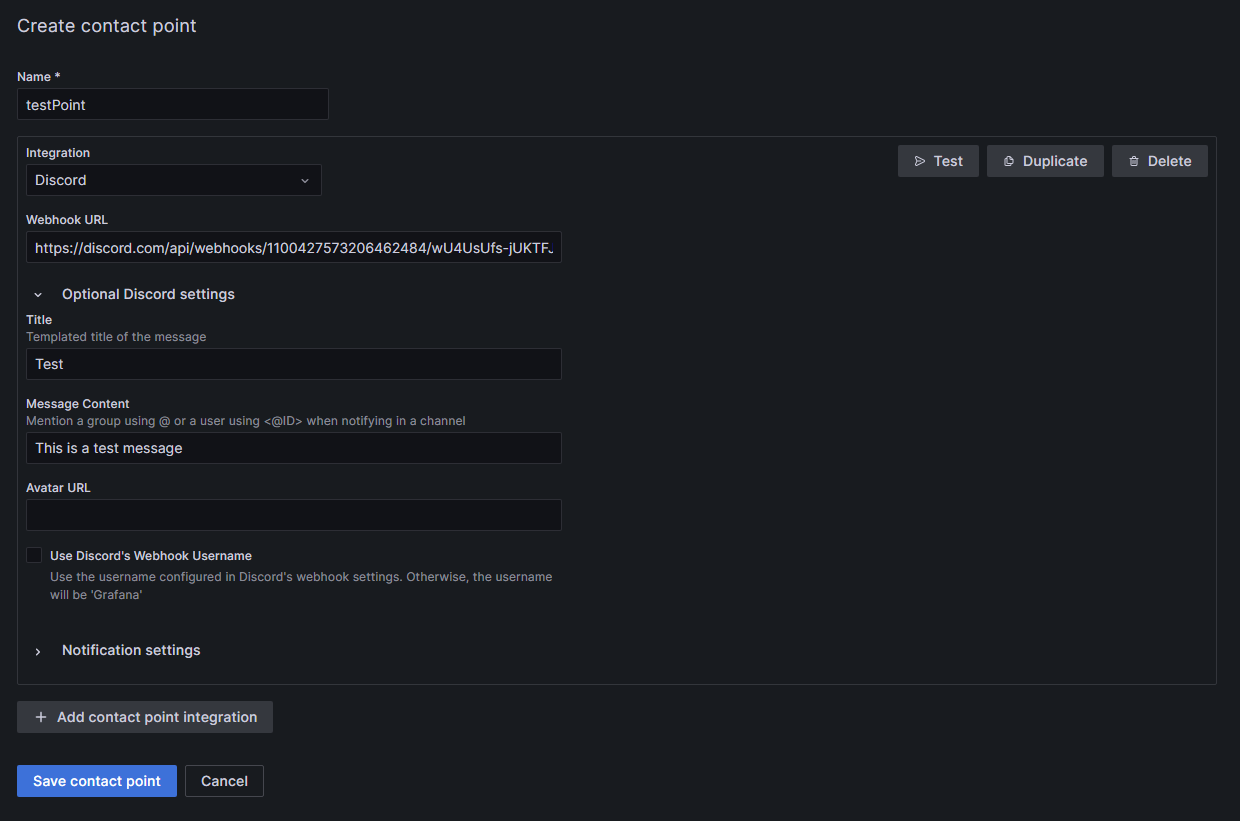
- Choose a name for your contact point.
- Pick the receiving service; in this example, Discord.
- Generate a new Webhook in your Discord server (Server Settings → Integrations → View Webhooks → New Webhook or create Webhook). Assign a name to the Webhook and designate the messaging channel. Copy the Webhook URL from Discord and insert it into the corresponding field in Grafana. Customize the message to Discord under Optional Discord settings if desired.
- If needed, add more services to the contact point, by clicking + Add contact point integration.
- Save the contact point; you can see it in the Contact points list, below the grafana-default-email contact point.
The integration of alerting by mail is very complicated to set up in Grafana and therefore not part of this tutorial.
Configure Notification Policies
A notification policy allows you to link alerts with a contact point. Notification policies can be added in the Notification policies section in the Grafana alerting page, next to Contact points.
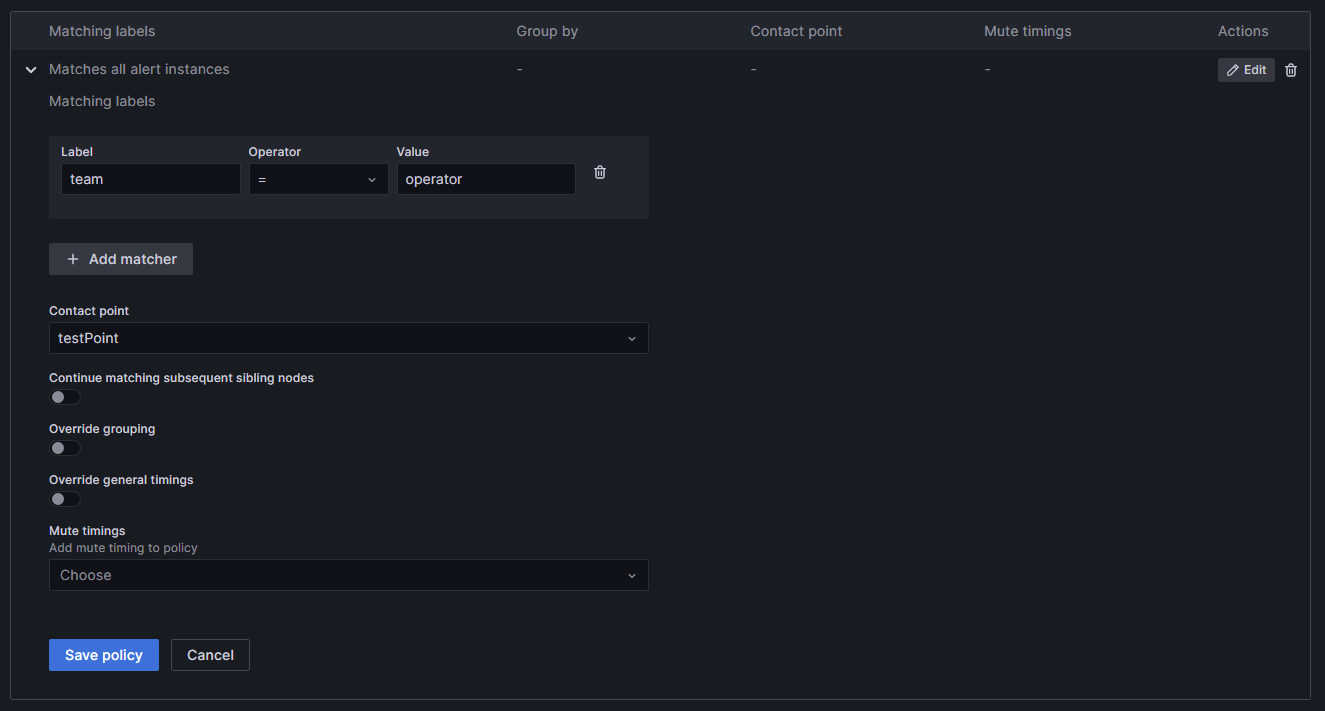
- Select + New specific policy to create a new policy, followed by + Add matcher to choose the label and value from the alert (for example
team = operator). In this example, both alert1 and alert3 will be forwarded to the associated contact point. You can include multiple labels in a single notification policy. - Choose the contact point designated to receive the alert notifications.
- Press Save policy to finalize your settings. Your new policy will now be displayed in the list.
Configure Mute Timing and Silences
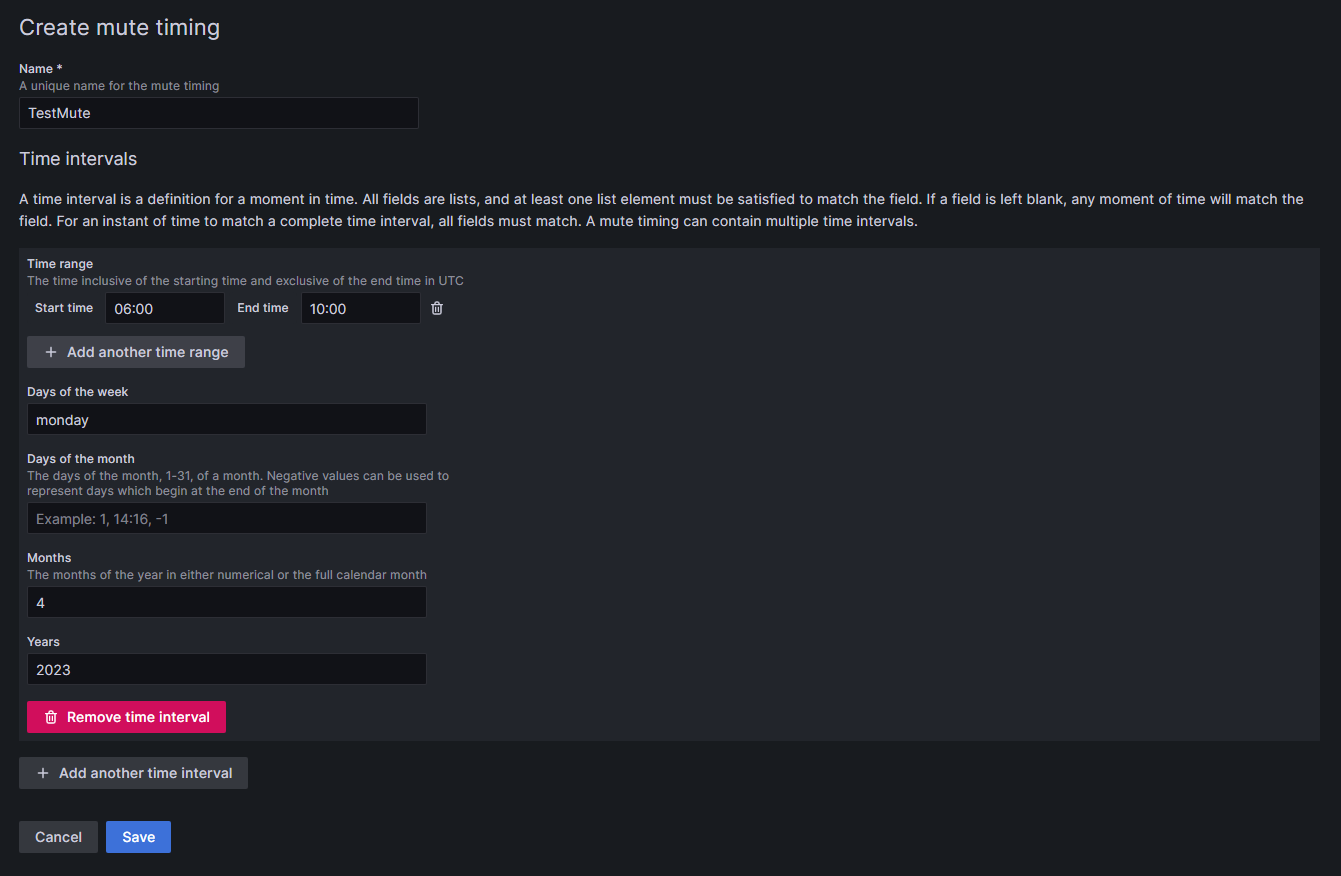
To avoid receiving alerts during specific, recurring time periods, create a mute timing that allows you to designate the exact time span when alerts will be muted. This could be times without shifts like on a weekend or mantenance. To set up a mute timing, remain in the Notification policies section.
- Select + Add mute timing below the notification policies.
- Choose a name for the mute timing.
- Specify the time during which notifications should not be forwarded.
- Time has to be given in UTC time and formatted as HH:MM. Use 06:00 instead of 6:00 to avoid an error in Grafana.
- You can combine several time intervals into one mute timing by clicking on the + Add another time interval button at the end of the page.
- Click Submit to save your settings.
- To apply the mute timing to a notification policy, click Edit on the right side of the notification policy, and then select the desired mute timing from the drop-down menu at the bottom of the policy. Click on Save Policy to apply the change.
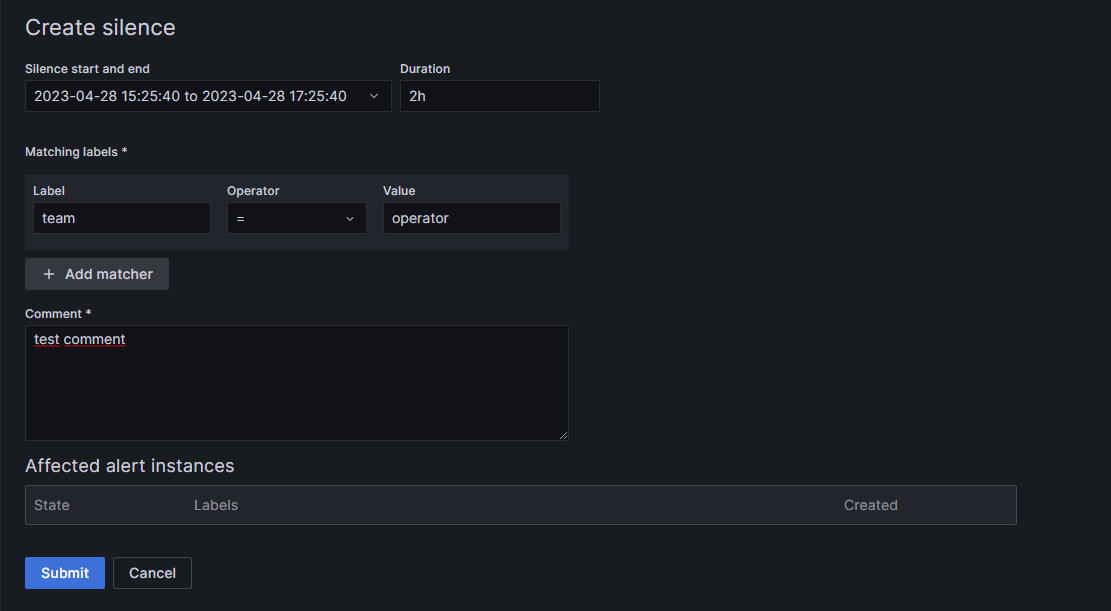
You can also add Silences for a specific time frame and labels, in case you only want to mute alerts once. To add a silence, switch to the Silences section, next to Notification policies.
- Click on + Add Silence.
- Specify the beginning for the silence and its duration.
- Select the labels and their values you want silenced.
- If needed, you can add a comment to the silence.
- Click the Submit button at the bottom of the page.
The alert is now completely set up and running. In case you followed the
tutorial with the simulated data, you should be receiving an alert in Discord
or the service you chose to receive the alerts. An alert is only sent out once
after beeing triggert. For the next alert, it has to return to the normal state,
so the data no longer violates the rule.


