
Diederik Vermeersch works as an Application Consultant at Mayker in Ghent, Belgium. The company regularly interacts with potential clients who are not familiar with the Industrial Internet of Things (IIoT). To offer these prospects something tangible, Diederik developed a "Demo Factory." This demo project aims to inform and convince prospects of the possibilities of manufacturing IT and the role of the United Manufacturing Hub (UMH).
Usually, IT presentations leave a lot to the viewer's imagination: "we have an MES here," and an ERP over there." Diederik wanted to make these abstract concepts more concrete by including as much hardware and visuals as possible to highlight the role of each software component. Today, Mayker uses the Demo Factory for sales, internal knowledge building, and showcasing at industrial conferences.
Introduction to the Demo Factory
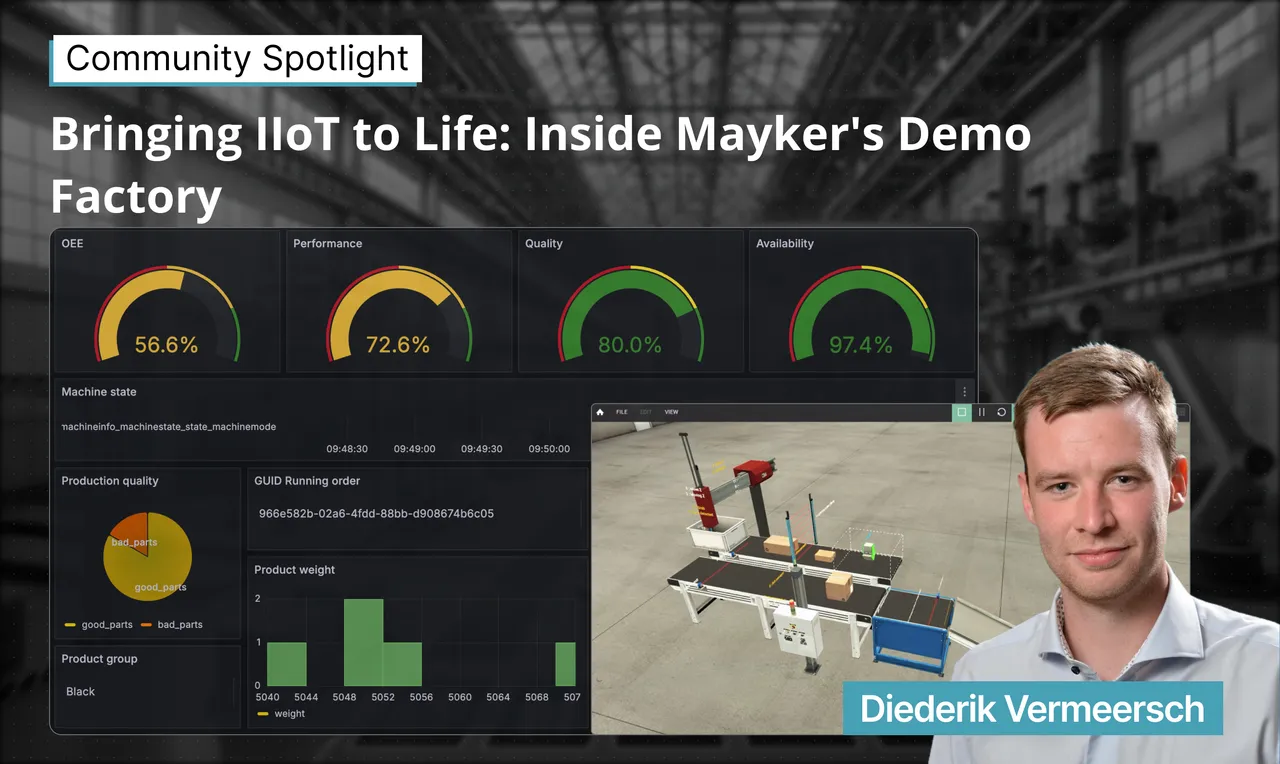
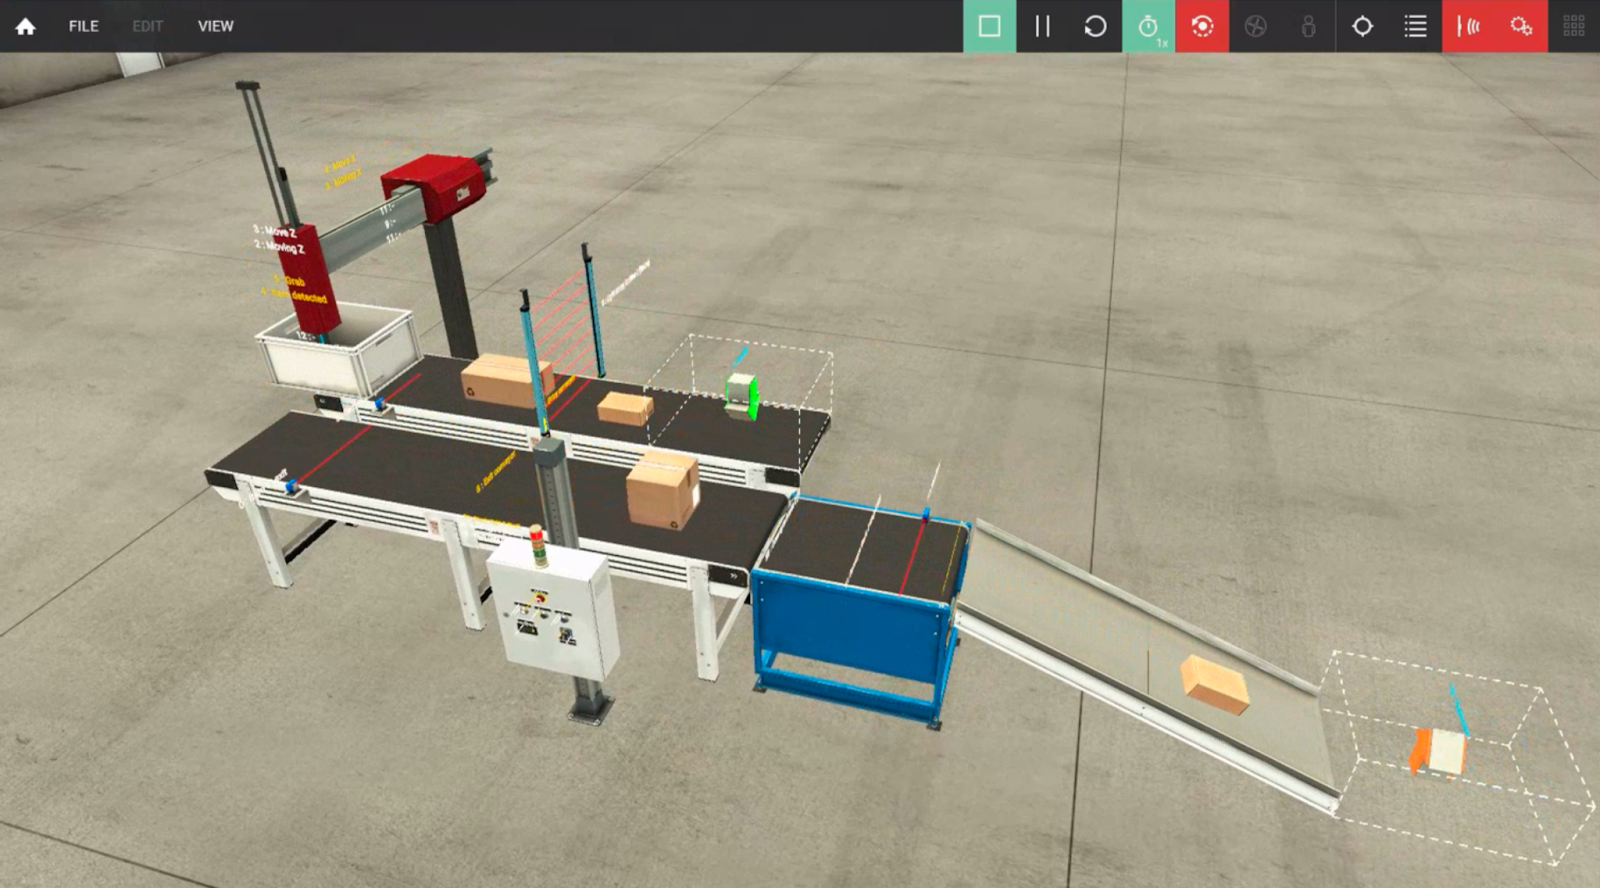
Ideally, to showcase manufacturing IT, one would like to display actual hardware. However, installing an assembly line in Mayker's office environment is not feasible. As the next best thing, Diederik deployed a digital twin of a packing conveyor belt. The digital twin shows a 3D model of an assembly line visualized in real-time with Factory I/O, a visualization tool based on the Unity game engine. To make the process realistic, the digital twin is controlled by an actual physical PLC in the Mayker office. The PLC program simulates packages moving up the assembly line. A box is generated and moves upward on an assembly line. Once the box reaches the sensor, an arm places it on the adjacent downward-moving assembly line.
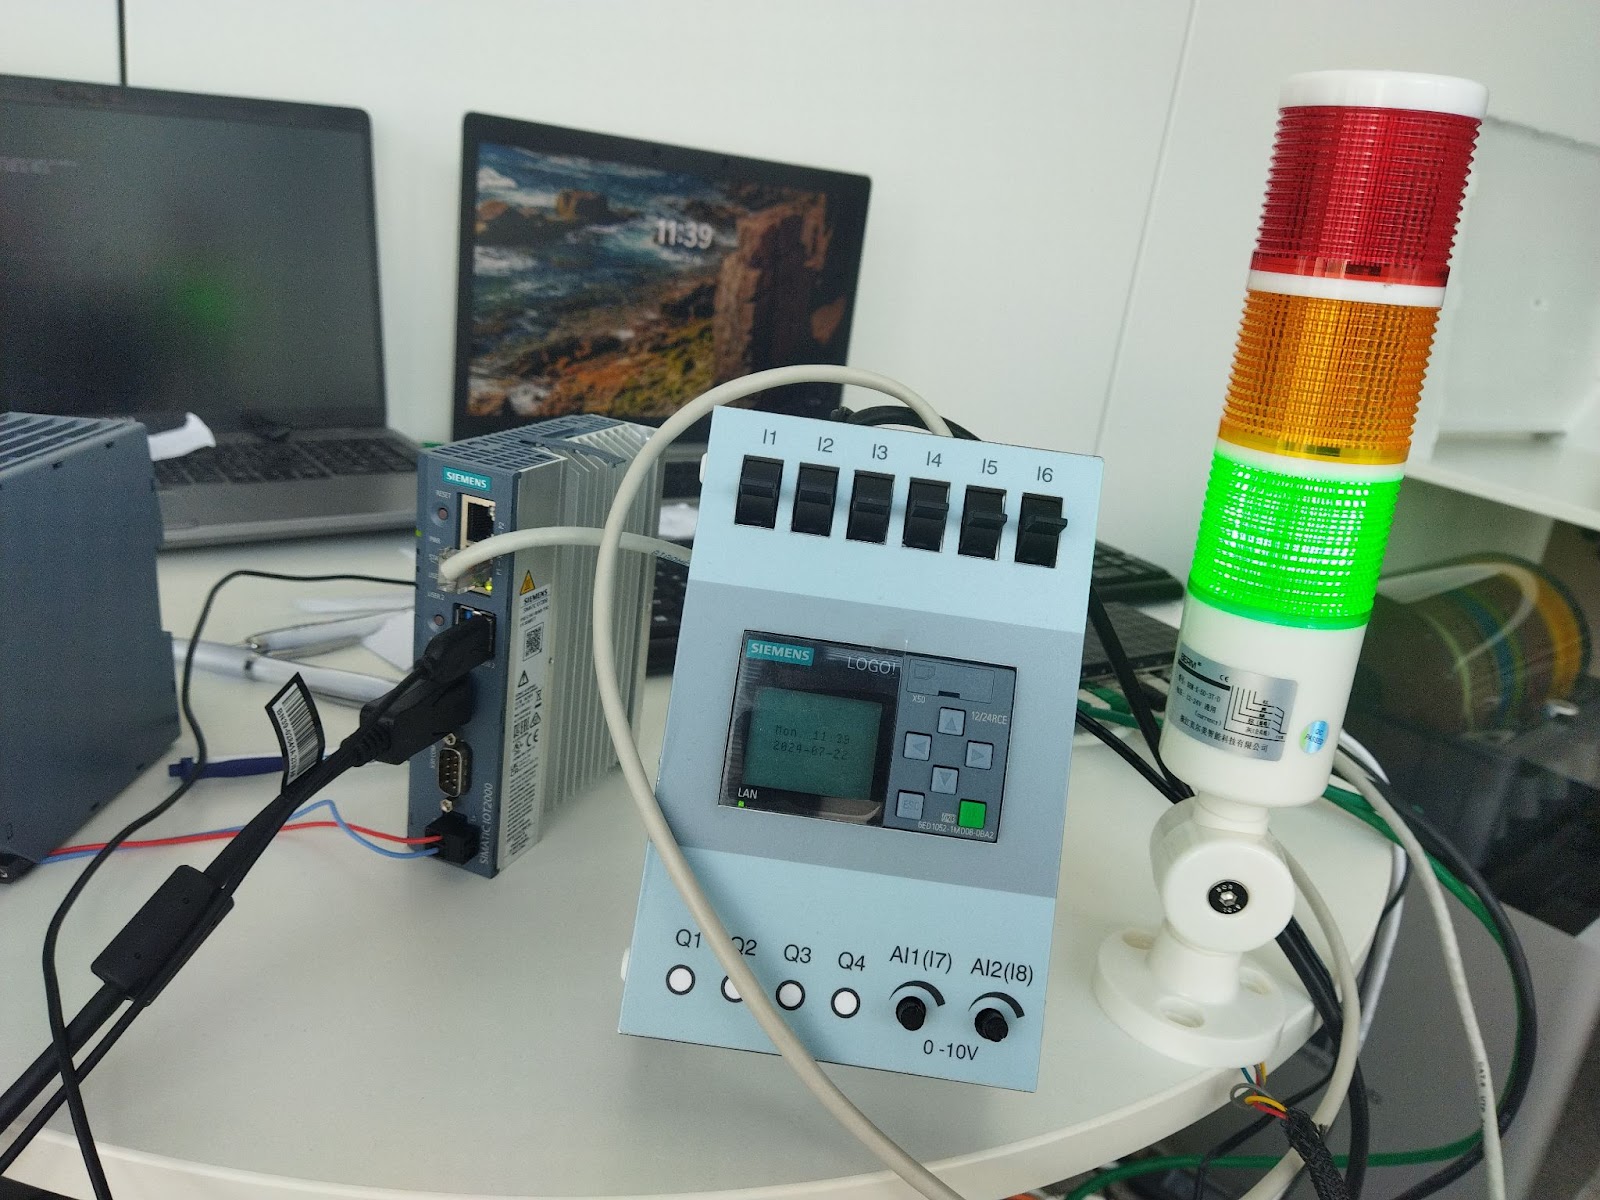
The PLC data (inputs and outputs) are communicated to a Siemens IoT2050 edge device, which can be compared to an "industrial Raspberry Pi." The edge device hosts a set of Docker containers for various tasks. One such task contextualizes the raw PLC data with Node-RED and writes it to specific MQTT topics of the UMH's HiveMQ broker. But raw data is not enough: desired metrics such as the Overall Equipment Effectiveness (OEE) require linking the raw data to information from an MES system. Specifically, Diederik wants to measure how long the conveyor belts stand still and move, and how many boxes are processed. This information is calculated from just two light sensors "virtually mounted" on the assembly line. Thus, from very limited data, rich information about the production process is calculated using Node-RED. The main Node-RED plugins used are ncd-io for reading gateway nodes and connecting via Modbus.
Another container running on the edge device supports data visualization using Grafana. A Grafana Private Data Source Connect (PDC) sends data directly to a Grafana dashboard in the cloud. The reason for using Grafana Cloud was to give the sales colleagues at Mayker (non-technical) easy access to the demo. They understand remote desktop, but not logging into a VM on Azure. This way, they can connect to Grafana Cloud and see the dashboard of the demo. The challenge is that data is saved locally, but the Grafana dashboard is in the cloud. This problem is solved by Grafana PDC, which is a very cost-effective solution. There's just one URL that can be accessed from anywhere in the world.
Hardware and tech-stack
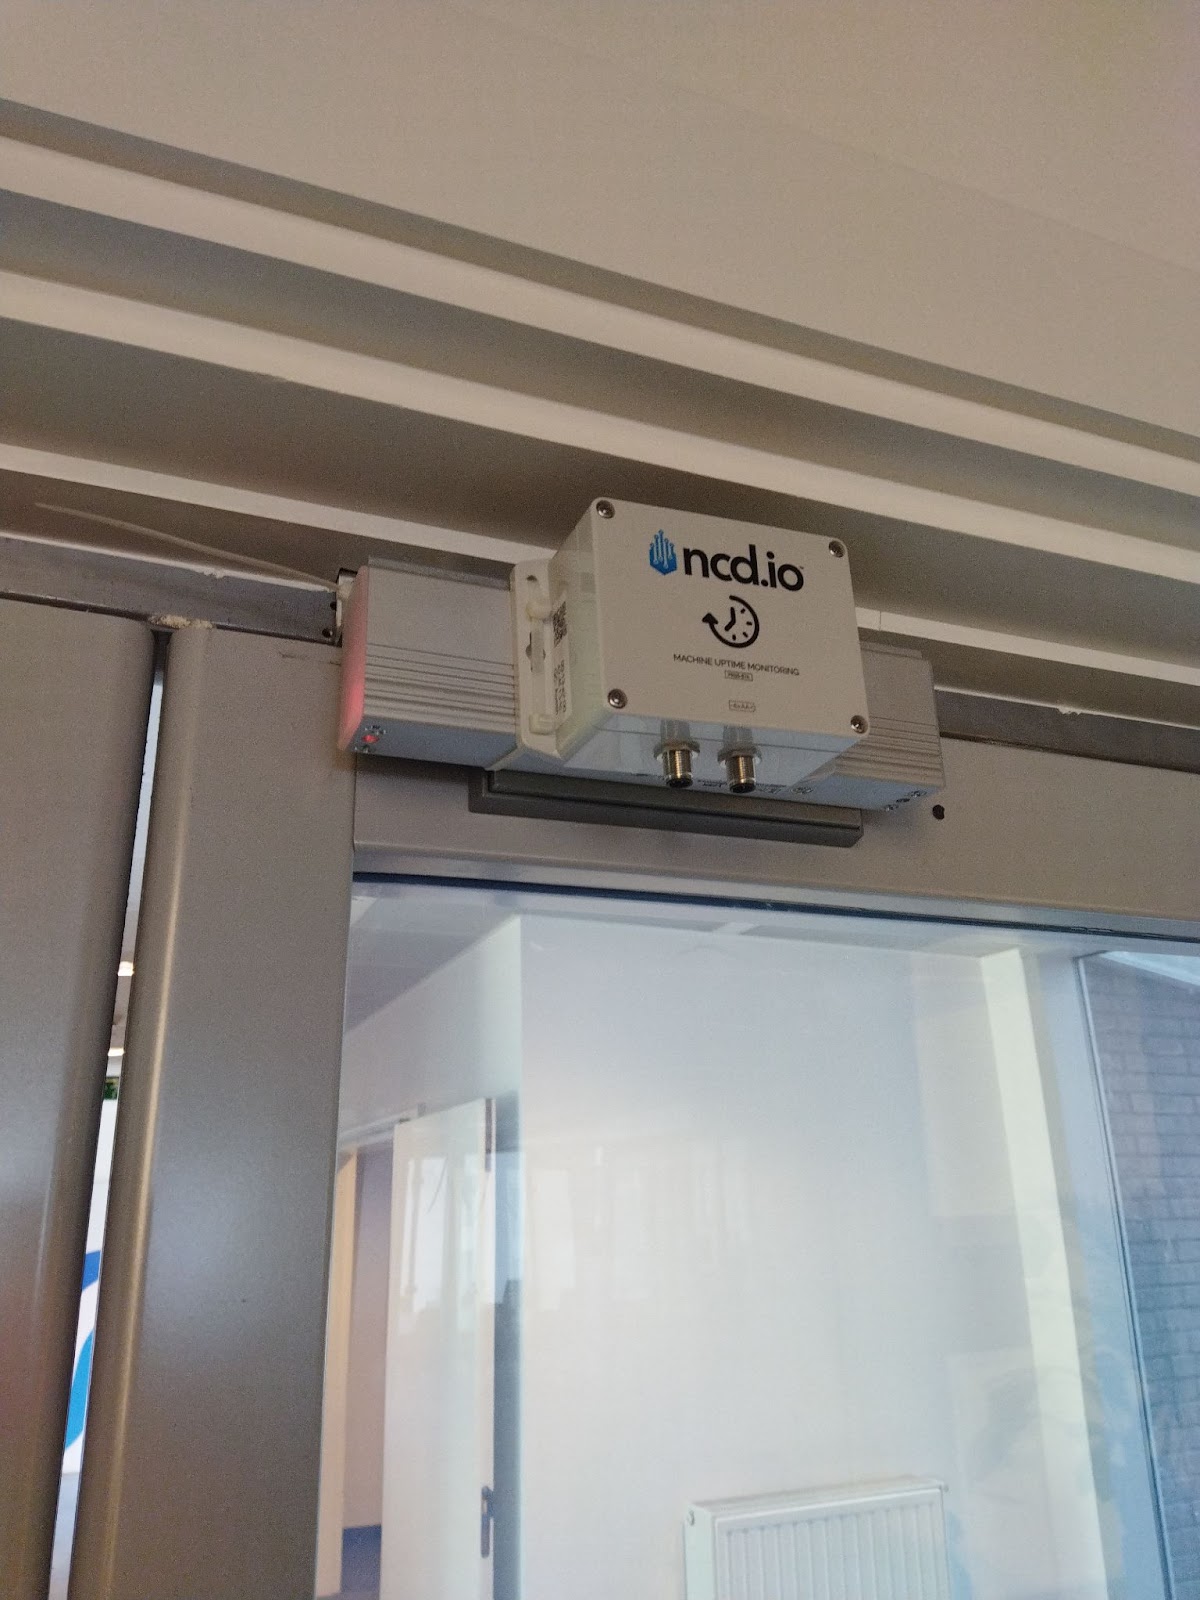
The UMH instance that supports the Demo Factory is connected to several hardware components. One of them is an Andon stack light connected to the digital twin. The light activates a particular color when the digital twin encounters an error. This way, the client can observe an abstract change in real life. Diederik also configured a connection to the magnetometer attached to the office door to register when the door opens and closes to measure foot traffic. Future plans include installing humidity sensors to collect HVAC data to monitor the office's environmental parameters.
To allow advanced analytics, the generated data is transferred to the cloud. The process works by aggregating JSON files in batches of 100 and sending them to Azure IoT Hub, which further writes them to Azure Blob Storage for cheap long-term storage. Diederik wanted to enable clients to play around with and analyze the data themselves, without breaking the Data Factory. To enable this, a copy of all MQTT topics is created on the UMH MQTT broker, to which the client is given read and write access. This way, the client can do anything they want without impacting the original data of the Demo Factory.
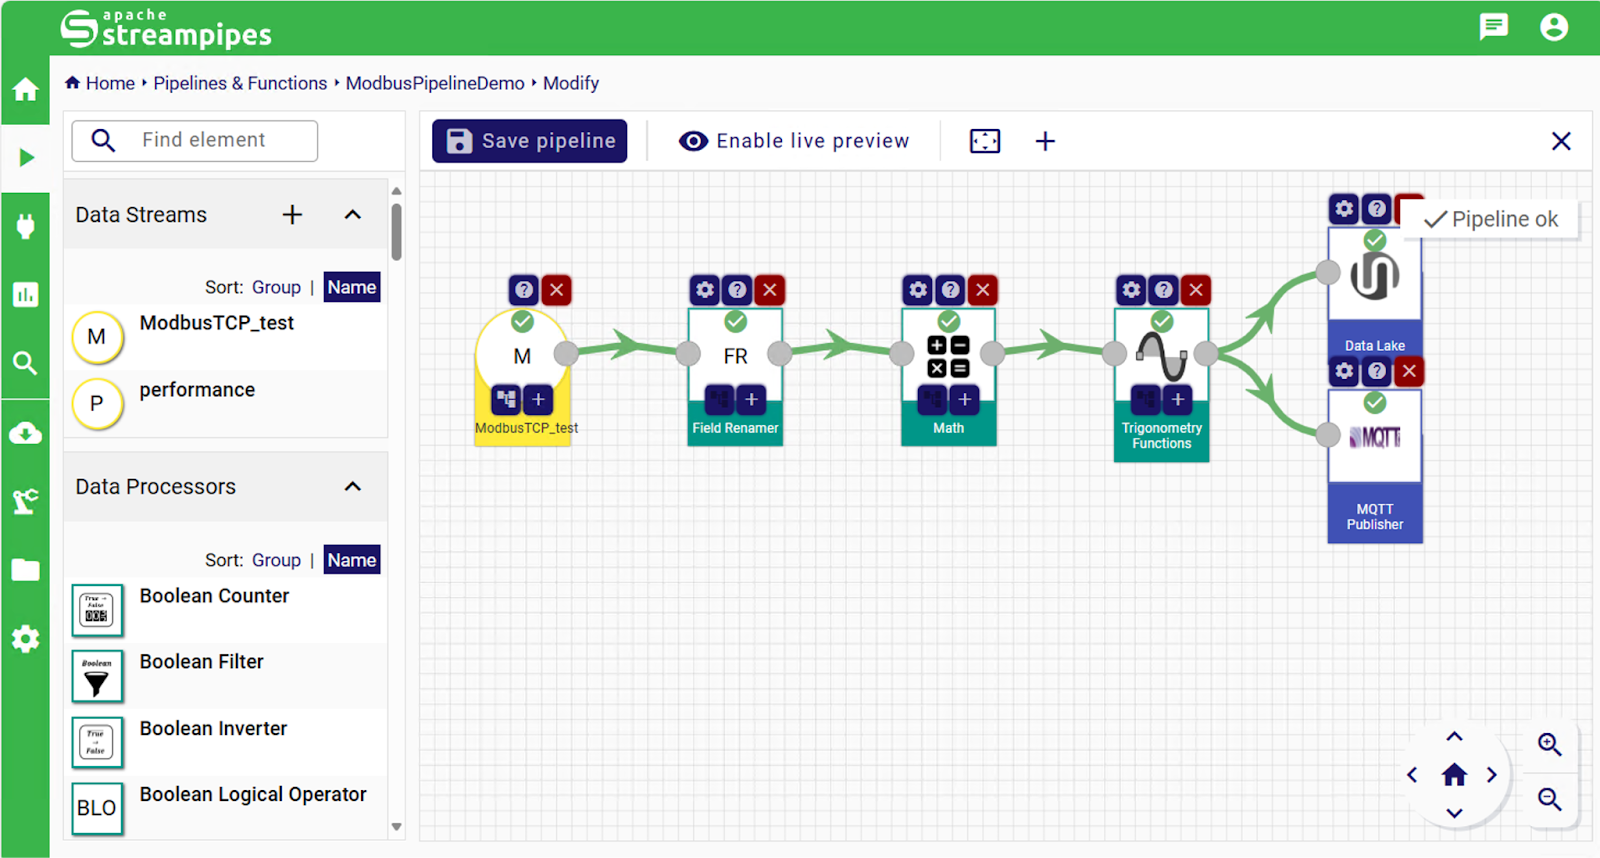
Another interesting software application connected to the Demo Factory's UMH instance is Apache Streampipes. It can be seen as an "open-source simplified alternative to HighByte". Like HighByte, the tool allows building data pipelines from many industrial data sources in a visual way by connecting nodes with arrows. This visual aspect appeals to clients. Although similar to Node-RED, Diederik found that the latter is often too difficult for clients. In that sense, Apache Streampipes lies between Benthos UMH (which is code-heavy) and Node-RED (graphical but not scalable): Apache Streampipes is scalable, visual, and cheap.
Integrating with the United Manufacturing Hub
The UMH is the central component that glues the above systems together. Diederik's Demo Factory leverages most of the components of the UMH: Node-RED, the Unified Namespace (UNS) consisting of the HiveMQ MQTT broker with Redpanda, the Historian (TimescaleDB), and Grafana in combination with Grafana PDC. The `_analytics` feature is not used. Instead, the OEE is calculated manually in a standalone MQTT broker.
Diederik appreciated the core infrastructure of the UMH: "you get the core data infrastructure preconfigured out-of-the-box." This infrastructure is also freely accessible: "everything is out in the open (broker, database, etc.)." This means that any component can be tweaked if necessary. The documentation is good, and the UMH developers are easy to reach via the active community. Although the UMH takes Operational Technology (OT) very seriously, it still adheres to Information Technology (IT) best practices. For example, providing Benthos for scalability and relying on Kubernetes for stability.
According to Diederik, potential points for improvement for the UMH are its data visualization capabilities. Although Grafana is great for visualizing real-time metrics, it falls short for advanced analytics. In that respect, integrating tools like Seeq would be a better alternative. Further, in some future use cases, Diederik anticipates the need for bidirectional communication between a dashboard and the production process. Currently, this is not supported by Grafana, but it could be accomplished via a Node-RED dashboard.
Conclusion
Overall, the Demo Factory is a great solution to showcase how the UMH can act as the central piece of data infrastructure, namely a UNS and Historian. It connects many different systems—both physical and virtual—from lamps in the office to storage systems in the cloud.
We at the United Manufacturing Hub are excited to see what Diederik and Mayker have been able to accomplish with the UMH and look forward to seeing what the future holds!
If you want to build similar dashboards, you can try our free community version here.


