The Challenge: Multiple Tags and Data Models for a Single Machine State
When collecting machine data, it's common to use protocol converters to gather various data points and push them into a Unified Namespace (UNS). However, identifying the exact machine state often requires analyzing multiple tags simultaneously. This complexity can make real-time monitoring and decision-making more challenging.
For instance, a machine might generate separate tags for operational mode, current state, and error codes. Individually, each tag provides only a limited snapshot of the machine's condition. However, when these tags are combined, they offer a comprehensive and detailed picture of the machine's overall status. By implementing an enterprise-wide standard organizations could enable consistent performance comparisons and simplify communication across various systems and teams.
Introducing the Weihenstephan Standard
The Weihenstephan Standard provides a structured approach to data acquisition and analysis, particularly in the food and beverage industry. It defines standardized interfaces and data formats, making it easier to integrate and interpret machine data.
Key WS tags include:
WS_state: The primary tag that provides details about the current machine state.WS_Mode: Indicates the machine's operational mode, such as automatic or manual.WS_Prog: Specifies the active program or process, like production or cleaning cycles.
By combining these tags, you can accurately determine the machine's actual state. For instance, if WS_state shows the machine is stopped and WS_Prog indicates it's in a cleaning cycle, you know the machine is currently being cleaned.
Implementing the logic with a custom data flow
To consolidate multiple data points into a single machine state, you can set up a custom data flow that continuously processes the incoming data points.
Step 1: Collect Raw Machine Data
Connect your machines using protocol converters and send all unprocessed data into the database via the _historian schema. This raw data serves as the foundation for your unified machine state.
Step 2: Create a Custom Data Flow
Under your Data Flows in the Management Console, create a custom data flow. You'll need to adapt the following Benthos configuration to match your specific setup.
Input Configuration
input:
  kafka_franz:
    seed_brokers:
      - united-manufacturing-hub-kafka.united-manufacturing-hub.svc.cluster.local:9092
    topics:
      - umh.v1.enterprise.site.*
    regexp_topics: true
    consumer_group: benthos-filler-line02
Explanation: This configuration connects to your Kafka broker to consume messages from specified topics, enabling real-time data ingestion from your machines.
Processing Logic
pipeline:
  processors:
    - bloblang: |
        if meta("kafka_key") == "Krones_L2.K100000._historian" && this.exists("Modulfill_cHMI_Modulfill_cHMI1_WS_Cur_State_0_UDIntValue") {
          root = {
            "start_time_unix_ms": this.timestamp_ms,
            "state": match this.Modulfill_cHMI_Modulfill_cHMI1_WS_Cur_State_0_UDIntValue {
              0 => 30000,
              1 => 40000,
              2 => 20000,
              4 => 40000,
              8 => 60000,
              16 => 70000,
              32 => 80000,
              64 => 80000,
              128 => 10000,
              256 => 20000,
              512 => 20000,
              1024 => 180000,
              2048 => 190000,
              4096 => 40000,
              8192 => 20000,
              16384 => 40000,
              32768 => 40000,
              65536 => 20000,
              131072 => 20000,
              262144 => 20000,
              524288 => 40000,
              1048576 => 40000,
              _ => 250000
            }
          }
        } else {
          root = deleted()
        }
    - branch:
        processors:
          - sql_select:
              driver: postgres
              dsn: postgres://kafkatopostgresqlv2:changemetoo@united-manufacturing-hub.united-manufacturing-hub.svc.cluster.local:5432/umh_v2
              table: tag
              WHERE asset_id = get_asset_id_immutable(
                'enterprise',
                'site',
                'area',
                'line2',
                'Modulfill',
                'K100000_TouchPC'
              ) and name = 'Modulfill_cHMI_Modulfill_cHMI1_WS_Cur_Prog_0_UDIntValue'
              suffix: ORDER BY timestamp DESC LIMIT 1
              columns:
                - value
        result_map: |
          root.state = if this == null || this.length() == 0 {
            root.state
          } else if this.index(0).value == 8 {
            110000
          } else if this.index(0).value == 16 {
            100000
          }
Explanation: The Bloblang processor transforms raw data by matching WS_Cur_State values to our standardized state codes. The SQL select query fetches the most recent state of WS_Cur_Prog from the database, allowing you to adjust the state based on additional conditions. From our experience the WS_Cur_Mode tag does not add particular value to the state classification and was excluded from the logic.
Output Configuration
output:
  broker:
    pattern: fan_out
    outputs:
      - kafka_franz:
          topic: umh.v1.enterprise.site.area1
          key: line02.Modulfill.K100000_TouchPC._analytics.state.add
          seed_brokers:
            - united-manufacturing-hub-kafka.united-manufacturing-hub.svc.cluster.local:9092
          client_id: benthos-classification-aggregator
Explanation: The output section sends the consolidated machine state back to a Kafka topic, making it accessible for dashboards, analytics, or further processing.
Step 3: Visualize Data in Grafana
With your data consolidated and pushed over Kafka to the database, you can now visualize it using Grafana similar to our templates from our webinar.
Exemplary Dashboard Design
Visualize the standardized states in a discrete timeline to show the states as selectable timeframes.

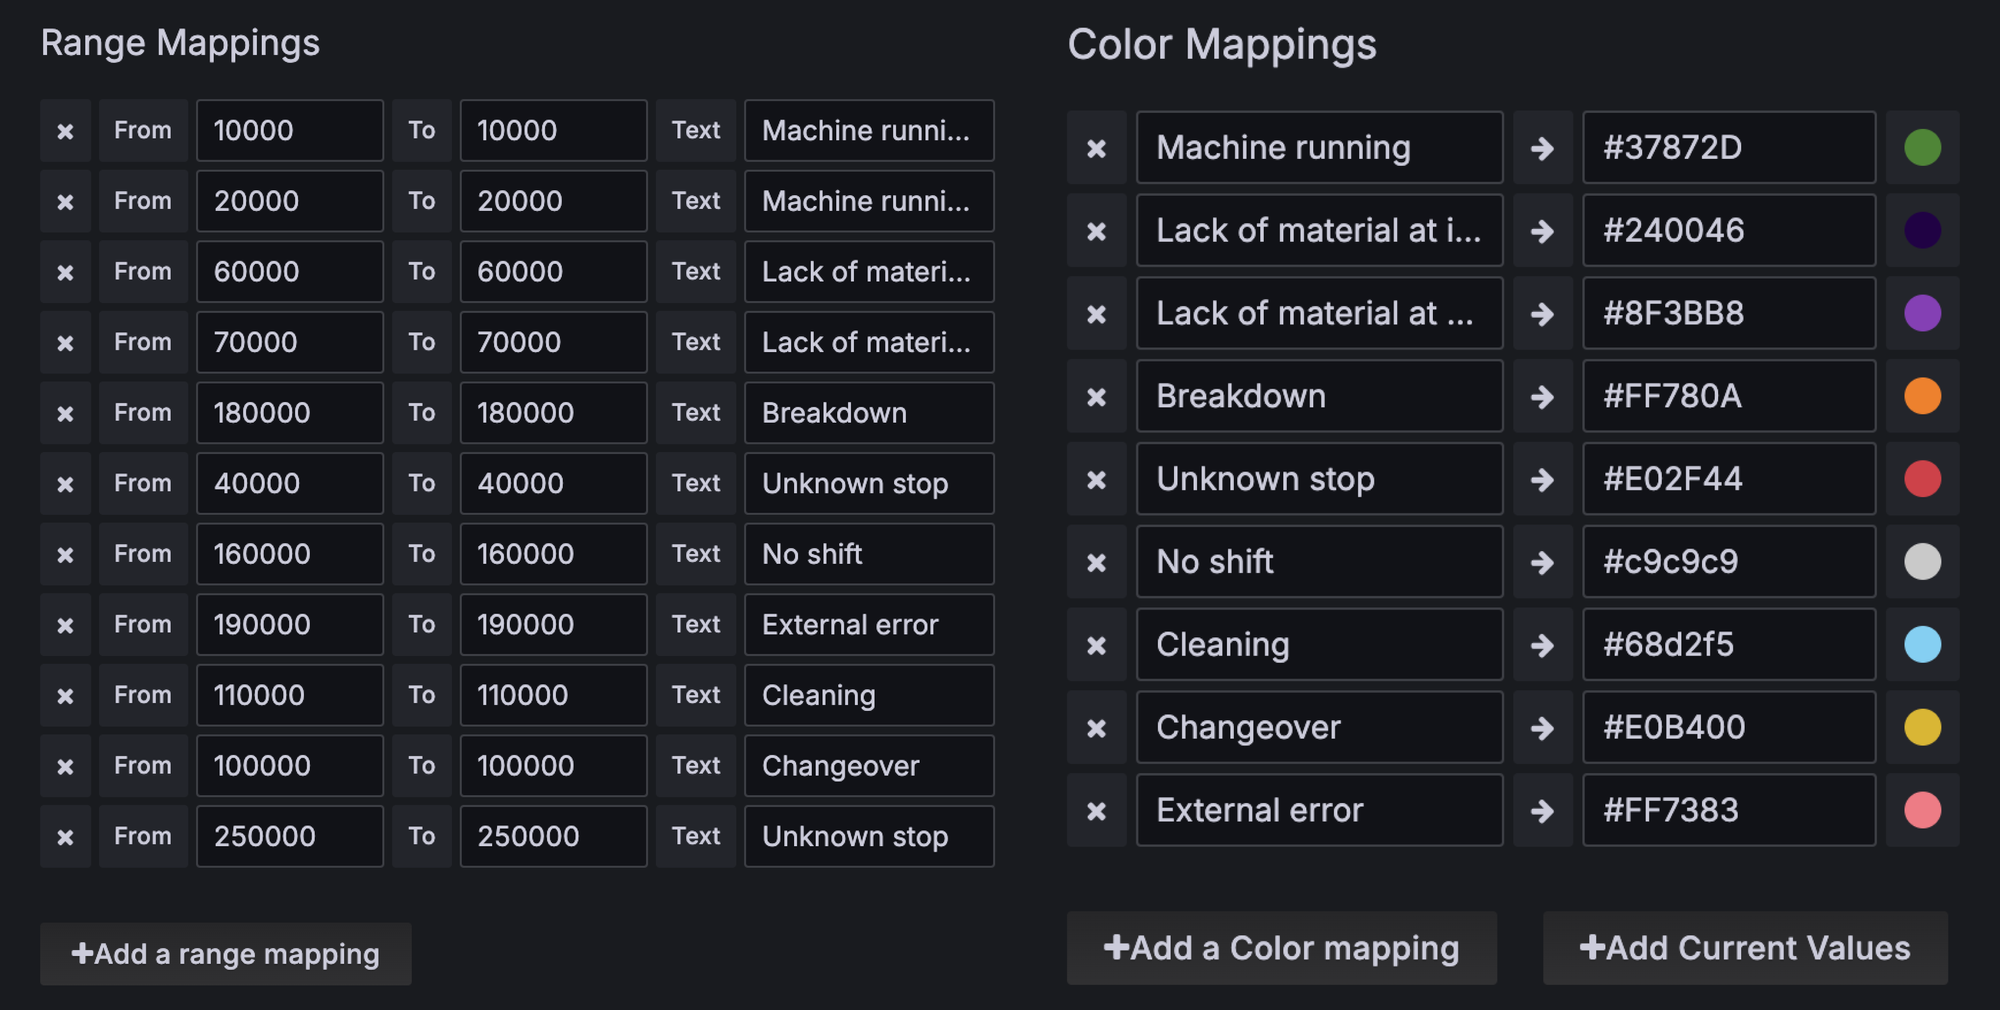
State Value and Color Mapping
To enhance readability, map state values to descriptive labels and assign colors.

Further Resources
For more information on state mapping, check out our State Documentation and for templates for data processing in benthos-umh our latest article.


