

💡
If you want to stay closer to the development process, you can find the (almost daily) releases and changelogs on our Discord: https://community-discord.umh.app/c/umh-roadmap
Q4 2025
New Features
- On-Demand Logs and Metrics Panels
- Access logs and metrics directly from any data flow component page
- Open panels using the Logs or Metrics buttons
- Side panel opens without leaving the current page
- Panels appear only when needed, keeping the UI clean
- Works across bridges, stream processors, and all data flow types
- Debug Logging for Troubleshooting
- Enable detailed debug logs by adding
debug_level: trueto bridge or data flow configs - Automatically activates verbose protocol-level logging
- Especially useful for diagnosing OPC UA connection issues
- Apply the flag in
config.yamland the bridge restarts with debug logging enabled
- Enable detailed debug logs by adding
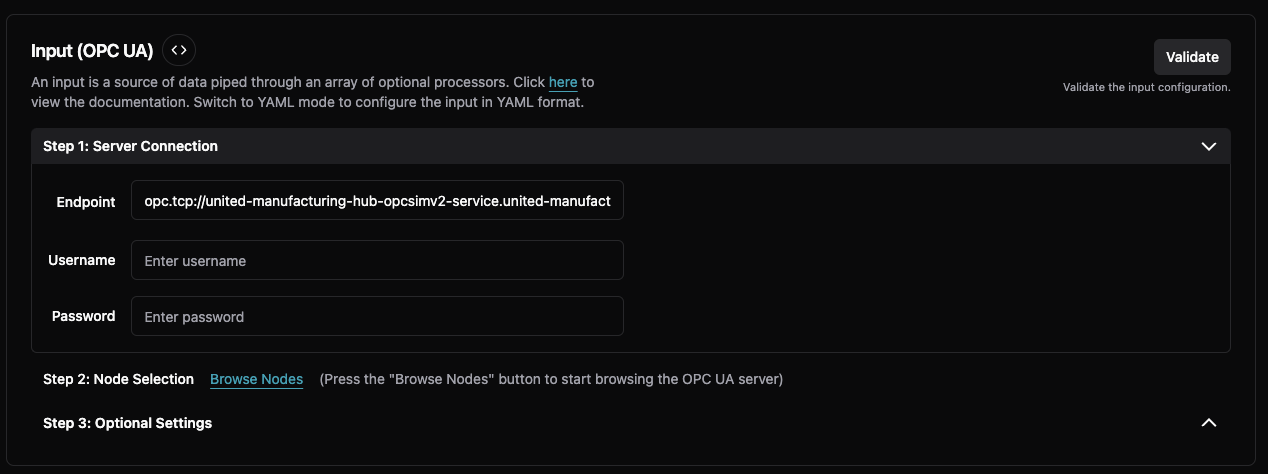
- Dynamic Protocol Forms
- Configure S7, Modbus, and OPC UA bridges using a form-based UI
- Toggle between Input (UI) and Input (YAML) in bridge configuration
- Edit fields directly and add addresses using the “+ Add” button
- YAML is generated automatically in the background
- Available as a preview feature and must be enabled via feature flag
- SparkplugB Template Documentation
- Default SparkplugB template now includes inline documentation
- Explains all available metadata fields with clear comments
- Supports pre-sanitized fields for building custom topic hierarchies
- Processes both DDATA and NDATA messages
- Includes practical examples for custom path construction
- Quick Condition Duplication
- Duplicate any condition with a single click using the new duplicate button
- Eliminates manual copy-paste when creating similar configurations
- New delete button includes a confirmation dialog to avoid accidental removal
- Both buttons include tooltips for clarity and ease of use
- Real-Time YAML Error Detection
- Shows instant red squiggly underlines for YAML syntax errors while typing
- Hover to see clear explanations of what’s wrong and how to fix it
- Prevents confusing post-save errors by catching 52% of mistakes before saving
- Cuts typical fix time from several minutes down to seconds
- Two-Tier Delete Confirmation
- Shows real-time logs during deletion instead of a spinning loader
- Logs include steps like “Stopping service…”, “Removing configuration…”, “Deletion complete”
- Dialog stays open with a “Continue” button so you can verify success before navigating away
- Removes confusion from previous silent, background deletions
- Data Compression Visibility
- Downsampler (report-by-exception) compression is now visible in a new Advanced Processing card
- Shows that compression is enabled by default for bridge data
- Helps you understand storage and network optimization happening behind the scenes
- Includes documentation links for clarity and competitive comparison
Improvements
- More Flexible Data Flow Naming - You can now use uppercase letters in data flow names. Previously only lowercase letters, numbers, and dashes were allowed. This gives you more freedom when naming data flows to match your existing naming conventions.
- Clearer Delete Buttons - Delete buttons (like "Remove Level" in location forms) now use a warning color with appropriate hover states. This makes destructive actions more visually distinct, reducing the chance of accidental deletions.
- Better Docker Cross-Platform Support - The Docker install command for local umh-core now uses Docker named volumes instead of bind mounts. This works consistently across Docker Desktop (Mac/Windows), native Linux, and Podman without requiring manual permission setup. Linux users without Docker group membership will see a clear permission error message.
- Cleaner Alert Messages - Status alerts and warnings throughout the app now have a more consistent look and feel. Whether you're viewing instance health, configuration warnings, or error messages, you'll see standardized formatting with clearer explanations. Technical details are now collapsible, keeping the main message front and center while still providing the detail you need for troubleshooting.
- Unified Button Styling - Buttons across the entire platform now follow a consistent design pattern. Primary actions stand out clearly, secondary actions are visually distinct, and icon buttons have consistent sizing and tooltips. This makes the interface feel more polished and easier to navigate.
- More Flexible Component Naming - You can now use uppercase letters (A-Z) in bridge and component names, in addition to lowercase letters, numbers, dashes, and underscores. This gives you more flexibility to match your organization's naming conventions.
- Persistent Sidebar State - Your sidebar collapse/expand preference is now remembered across sessions. Open or close the sidebar once and it stays that way when you return.
- Smarter Back Button Navigation - The back button now works more like your browser's back button. This makes navigation feel more natural and predictable, especially when drilling down through multiple screens.
- Consistent Toggle Buttons - The code/UI toggle button in stream processors now matches the design and behavior of the ViewModeToggle component used elsewhere in the Management Console. You'll notice cleaner, more professional-looking controls with consistent styling across all configuration screens.
- Better Code Editor Intelligence - Fixed the tag processor editor incorrectly flagging
consoleand other standard JavaScript APIs as errors with red underlines. The Monaco editor now properly recognizes these built-in functions, giving you accurate IntelliSense and eliminating confusing false-positive warnings while writing your code. - Smoother Page Scrolling - You can now scroll smoothly over YAML editor areas without the editor hijacking your scroll. Previously, scrolling over a YAML editor would get stuck inside the editor, forcing you to scroll through the entire editor content before continuing down the page. Now, you'll see a "Click to edit" indicator when hovering - just click inside the editor when you want to edit or scroll through its content. This improves navigation flow when reviewing long configuration pages with multiple YAML editors.
- Clearer UI/YAML Mode Switching - The toggle button for switching between UI and YAML views now uses a familiar switch design instead of icon buttons. The new switch clearly labels "UI" and "YAML" sides, making it immediately obvious which mode you're in and how to switch. This addresses feedback from customers who found the previous code icon unclear. The improved toggle works across all configuration areas including bridges, stream processors, and data models, and adapts properly to mobile screen sizes.
- Cleaner Location Configuration - Location forms now only show the location levels you're actually using, hiding empty levels that previously cluttered the interface. When selecting an instance, you'll see only the populated location levels (e.g., just Level 0 and Level 1 if that's all the instance has) with an "Add Level N" button to add more as needed. Additionally, inherited location values from selected instances are now properly preserved instead of being overwritten with defaults. Location fields now follow progressive disclosure principles, appearing only after you've selected an instance.
- Better Error Guidance in Stream Processors - Stream processor UI mode now shows validation errors with clear guidance when configuration issues occur. If you encounter an error (such as variable name conflicts), you'll see a helpful message suggesting you switch to YAML mode for more flexibility in resolving the issue. The variable name generator also now avoids conflicts with data model field names by automatically adding a
_srcsuffix when needed (e.g., if you have a topic named "pulse" and a data model field "pulse", the source variable becomes "pulse_src"). - Documentation Consistency - Getting started guide now uses "umh-core-data" folder name consistently across all documentation, eliminating confusion when following different guides
- OPC UA Browse Performance - Browse operations now use a global worker pool instead of creating separate pools for each starting node, preventing worker exhaustion. Previously, browsing 300 nodes with MaxWorkers=20 created 6,000 concurrent workers; now uses 20 workers total. This prevents overwhelming servers with limited concurrent action capacity (e.g., Ignition's Eclipse Milo implementation with 64 concurrent actions per session)
- OPC UA Server Compatibility - Automatic detection and optimization for Ignition, Kepware, Siemens S7-1200/S7-1500, and Prosys OPC UA servers with vendor-specific tuning
- S7-1200 PLC Support - Automatic detection when Siemens S7-1200 PLCs don't support DataChangeFilter (Micro Embedded Device Profile), preventing subscription errors
- Data Infrastructure Independence - Your production system no longer depends on Management Console connectivity to start. Previously, when Management Console was unreachable, the entire data infrastructure would fail to start and block indefinitely. Now the system starts immediately and retries the connection in the background, eliminating the single point of failure.
- Faster Deployments with Large Configurations - Deployments complete 80-90% faster for customers with large configurations (e.g., 2,000+ OPC UA nodes). The system now logs configuration differences only at debug level instead of logging full structures on every change, dramatically reducing overhead during updates.
- OPC UA Large Server Support - Fixed critical deadlock when browsing OPC UA servers with more than 100,000 nodes. Previously, browse operations would hang indefinitely and require container restarts. Now completes in under 1 second for 110k nodes, enabling large-scale OPC UA deployments.
- OPC UA Performance Boost - Browse operations now complete up to 173x faster with 75-90% less memory usage. Connection times for large OPC UA servers are significantly faster, and CPU usage during browse is dramatically reduced.
- Reduced Network Traffic - OPC UA bridges now automatically suppress duplicate value notifications (deadband filtering), reducing unnecessary network traffic and processing overhead. Enabled by default for all numeric node types.
- Better JavaScript Debugging - Fixed
console.log()and other console methods in Node-RED JavaScript processor to work like browser environments. You can now properly debug JavaScript transformations by logging complex objects and seeing their actual structure instead of[object Object]. - Faster Component Navigation - You can now click directly on component names to edit them, instead of using the three-dot menu every time. This works across Instances, Data Flows, and Models - just click the name in the table and you'll navigate straight to the configuration page. The three-dot menu is still available for additional actions, but your most common task (editing) is now just one click away.
- Clickable Protocol Converter Names in Data Flows (Classic) - Fixed broken links when clicking on protocol converter names in the Data Flows (Classic) view. Previously, clicking a name would generate an incorrect URL and show an error. Now it properly navigates to the protocol converter configuration page with all the correct parameters, saving you from having to use the three-dot menu.
- Clearer User Invitation Error Messages - When viewing the user list, you'll no longer see confusing dates like "January 1, 1970" for users whose invitations failed. Instead, you'll see a clear red "Invite Failed" message, making it immediately obvious which invitations need to be resent.
- Resource Blocking Enabled by Default - New protocol converter deployments are now automatically blocked when your system is at capacity (high CPU/memory/disk usage). This prevents system instability from overload. You'll see clear messages explaining why deployment is blocked and how to resolve it.
- Clearer Resource Blocking Messages - When your system blocks a protocol converter deployment due to resource constraints, you'll now see the actual reason (like "CPU utilization critical - Reduce system load or disable resource limits") instead of a generic timeout message. This helps you understand whether to reduce load, add more resources, or adjust limits.
- OPC UA Quality Tag Support - OPC UA data connections now capture quality/status codes from OPC UA servers, appearing in metadata as
opcua_attr_statuscode. This helps you verify data reliability from industrial equipment, especially useful for Ignition-based OPC UA servers where quality tags indicate whether data points are trustworthy. - Better Error Visibility - Stream processors now show clear warning messages when they receive incompatible data formats (like JSON objects instead of time-series data). Previously, data would silently disappear without explanation, which could block troubleshooting for hours.
- More Flexible Component Naming - You can now use underscores in bridge and component names. Previously only lowercase letters, numbers, and hyphens were allowed. This makes it easier to match your existing naming conventions, especially if you're migrating from other systems that use underscores.
- Better Health Status Display - Idle protocol converter states now correctly show as green/active instead of appearing unhealthy. This prevents false alarms when your data sources are legitimately inactive or waiting for data.
Q3 2025
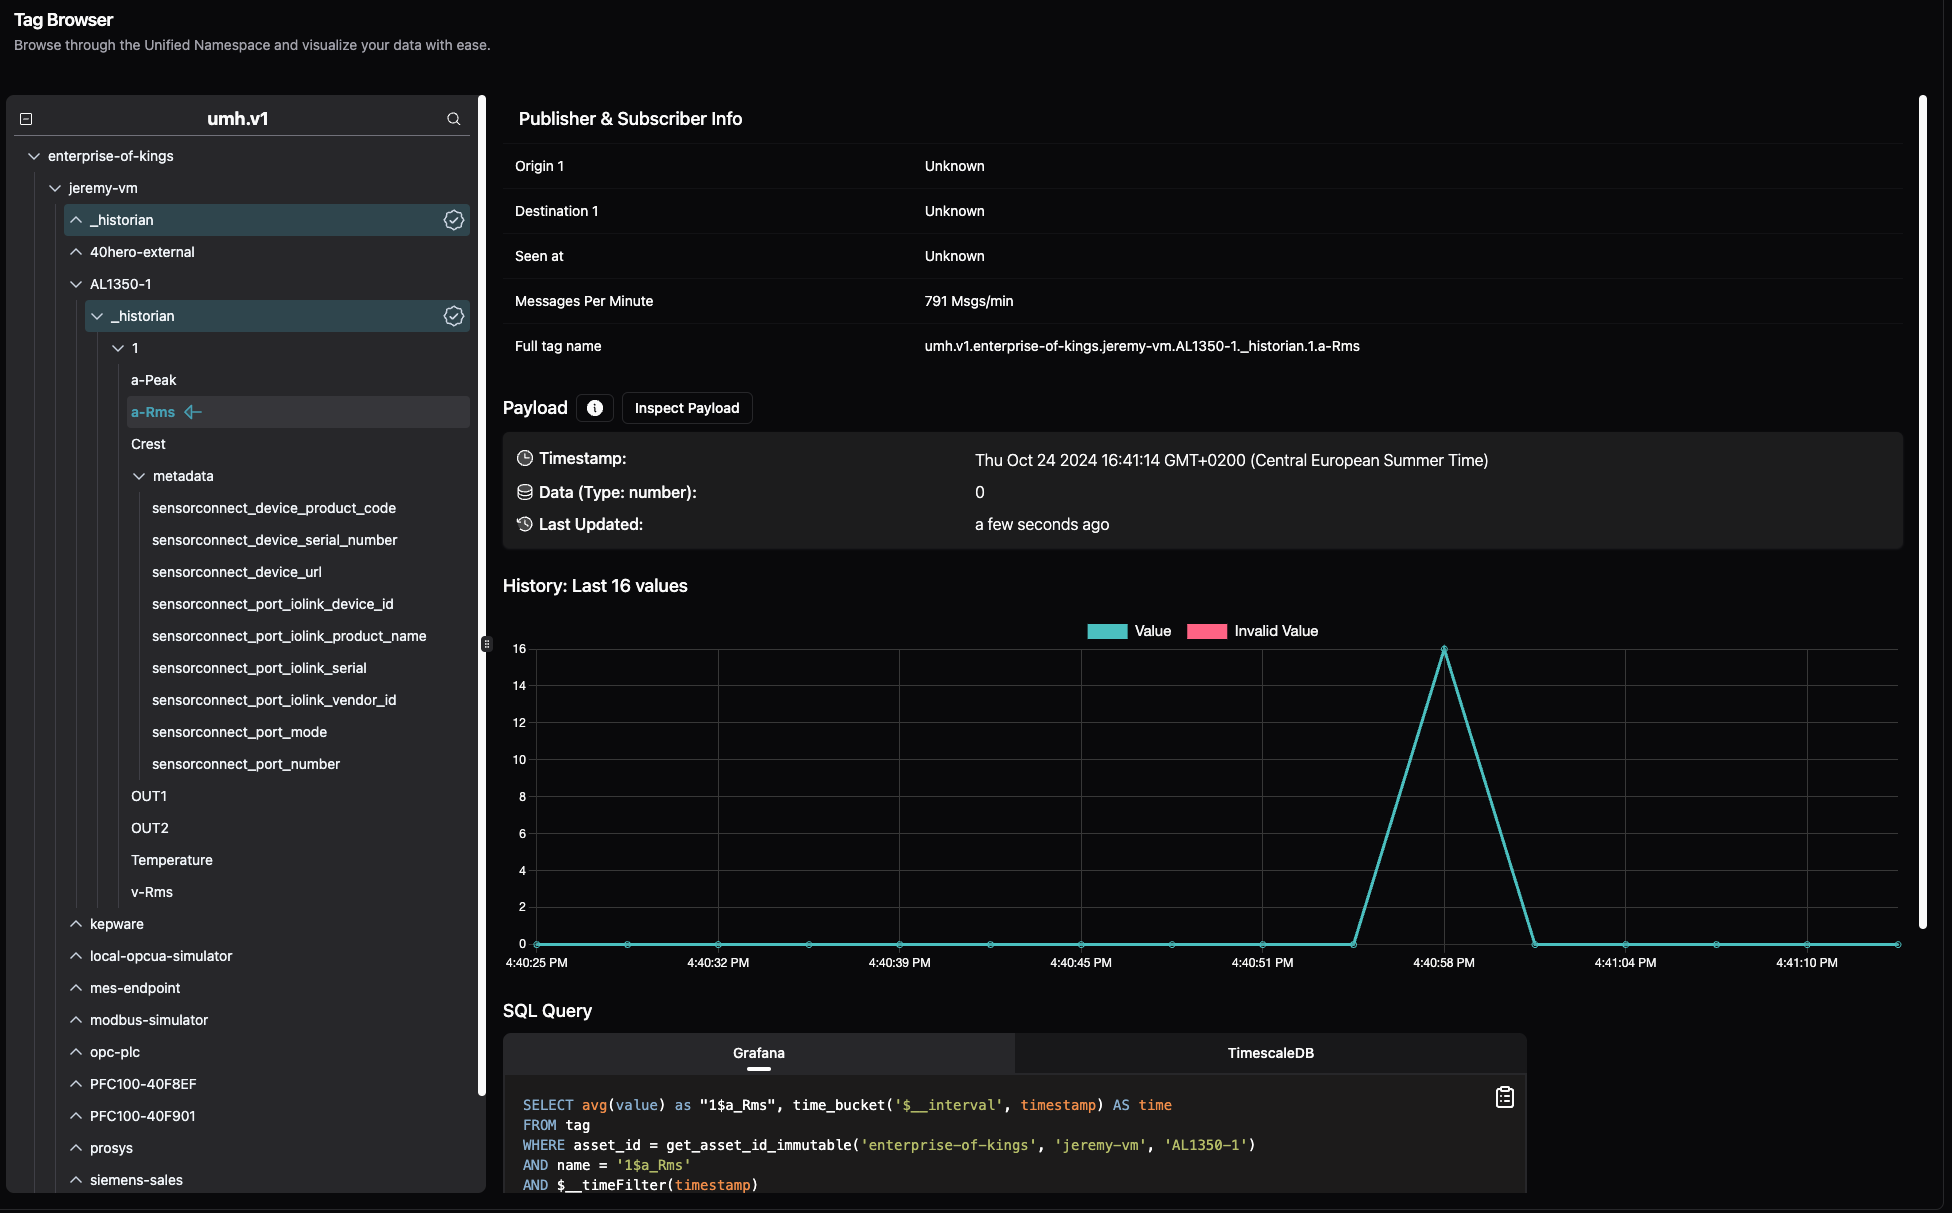
- Topic Browser Live Updates
- Topics now highlight in real time when they receive new data — just like MQTT Explorer.
- A brief animation appears on the entire path whenever values update.
- Makes it easy to spot active data flows without manually checking each topic.
- Dynamic Location Levels
- Define custom hierarchical location levels for bridges and stream processors.
- Create as many levels as needed (Level 0, Level 1, Level 2, etc.) to fit your structure.
- The first level (Level 0) is always required and visible for consistency.
- Enhanced User Permissions (V2 Certificates)
- New certificate system with granular, location-based roles.
- Assign specific permissions per level — from enterprise to line.
- Fully redesigned UI with better forms, validation, and clarity.
- Central access management for UNS
- Unified access control for your entire Unified Namespace.
- Single login for all authorized systems, with ISA-95-level permissions.
- Integrates directly with Active Directory, SAML 2.0, and MFA.
- No VPN chains or jump hosts — production data stays securely on your network.
- New benthos-umh version
- Adds sanitized SparkplugB metadata fields automatically.
- Simplifies UMH topic creation in user-defined processing.
- Eliminates manual cleanup of special characters from IDs.
- Automatic Resource Protection
- (Disabled by default) Prevents too many data connections when CPU, memory, or disk are limited.
- Automatically pauses and resumes connections as resources recover.
- Disabled by default to allow full control.
- CPU Throttling Detection
- Detects when CPU throttling occurs due to resource constraints.
- Improves visibility into performance limits during heavy workloads.
Improvements
- Redesigned Bridge Configuration - We've completely reorganized the bridge configuration interface for better clarity:,
- Split into three logical tabs: General, Connection, and Read Flow,
- Connection details are always visible in the Read Flow tab, so you always know which bridge you're configuring,
- New bridges now properly enable all required tabs with clear "Required" badges,
- Bridge monitoring shows clearer status with "Active" or "Down" states plus real-time latency,
- See also: https://supercut.ai/share/umh/EhHkzOSEO8ES4NIt9qXUJx,
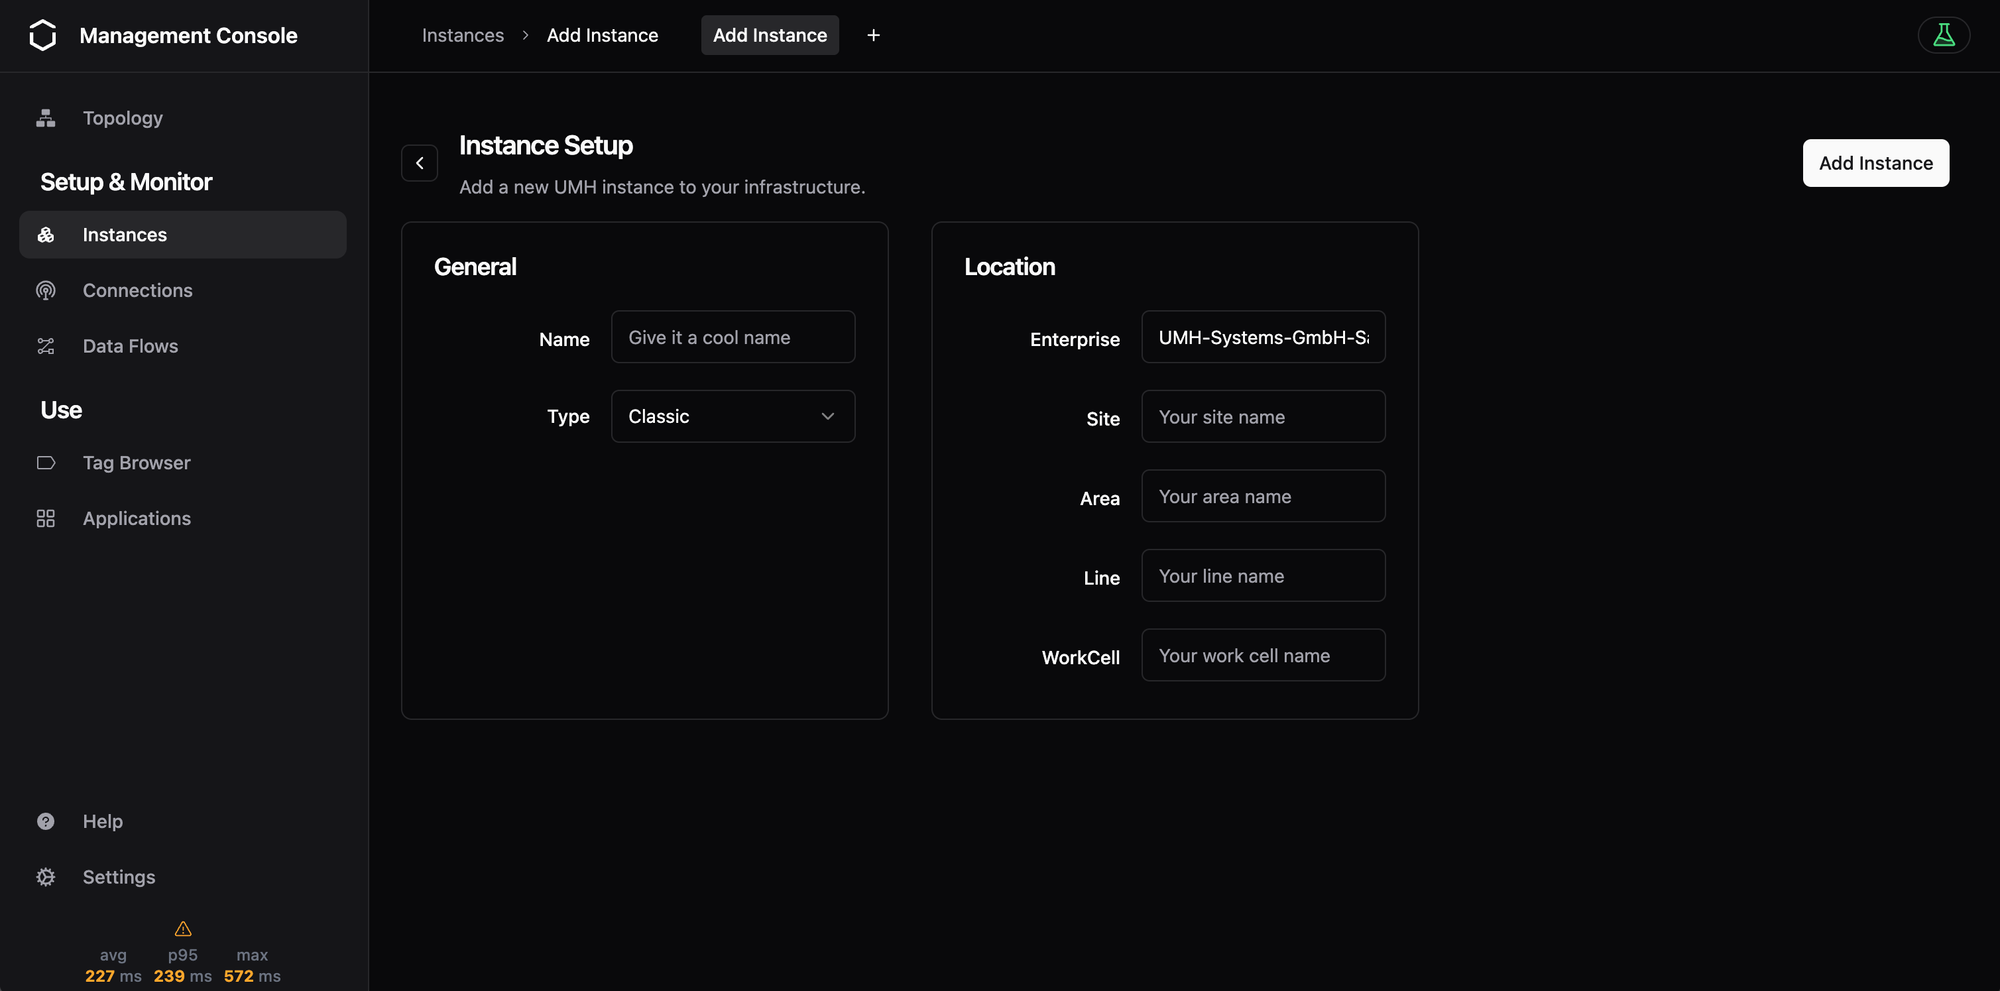
- Simplified Instance Creation - UMH Core is now the default installation type for new instances, streamlining the onboarding process. The outdated requirements panel has been removed, with system requirements now linking directly to the documentation.,
- Clearer Validation Messages - Removed confusing RFC 1123 references from validation errors. Messages now simply state "Only lowercase letters, numbers, and dashes are allowed" for better clarity.,
- Automatic Report-by-Exception for All Bridges - All timeseries bridges now include an automatic downsampler that uses report-by-exception: data is only sent to the UNS when the value or payload changes. This dramatically reduces storage and network usage while preserving all meaningful data. The default configuration removes exact duplicates and provides a 30-minute heartbeat for sensor health monitoring.⚠️ Important for Testing: The downsampler filters messages with identical payloads. If you're testing with a Generate protocol or static test data (like
root = "hello world"repeatedly), you'll see metrics showing messages received but not appearing in the Topic Browser. This is intended behavior - the downsampler is filtering duplicates to save storage.For testing or debugging:- Add
msg.meta.ds_ignore = "testing"to your mapping to bypass the downsampler - Or use changing values in your test data:
root = "test-" + uuid_v4() - For production use with noisy sensors, adjust the threshold to filter sensor noise (see downsampler documentation)
- Add
- Clearer Status Messages - All status messages now use plain language instead of technical jargon. What was "DFC" is now "flow", "Protocol Converter" is now "bridge", and "Source/Sink Flow" is now "Read/Write Flow". You'll see messages like "starting: waiting for flow" instead of "starting: waiting for DFC". All your existing configurations continue working—only the messages you see have changed.
- Network Reliability - Resolved "instance offline" issues caused by network instability and connection resets to management.umh.app. Added intelligent HTTP retry logic that automatically recovers from transient failures (connection resets, timeouts, EOF errors) using exponential backoff with up to 10 retries. The communicator now handles message queue overflow scenarios that previously required manual restarts. Implementation includes refactored HTTP client package for better maintainability.
- Data Processing - Updated benthos-umh to v0.11.3, adding pre-sanitized SparkplugB metadata fields (
spb_group_id_sanitized,spb_edge_node_id_sanitized, etc.) that simplify UMH topic construction by providing alphanumeric versions with special characters already replaced. - Smarter Instance Selection - The system no longer auto-selects the first instance when creating bridges, standalone flows, or stream processors. This prevents accidental deployments to the wrong instance. You'll now explicitly choose your target instance, with helpful error messages if you forget to select one.,
- Better Navigation - Click on throughput values for any Data Flow Component (bridges, standalone flows, protocol converters) to quickly navigate to their configuration pages. Previously this only worked for bridges.,
- More Robust Deployments - Fixed the "black dialog" issue that sometimes appeared when deploying standalone flows. The diff view now preloads in the background for increased reliability, ensuring the deployment dialog always displays correctly.,
- Localhost Warning - Added a warning when the user selects localhost to notify the user that he will be working iwhtin the contaienr and not on the host system
Q2 2025
- UMH-Core v0.37.0
- Introduces the Topic Browser service (browse Kafka topics from the console), richer Redpanda health/metrics, mock-manager for system-state testing, and automatic troubleshooting docs. Also bumps benthos-umh to 0.9.4 and adds log-rotation-aware GetLogs.
- UMH-Core v0.36.0
- Adds the first Protocol Converter service & FSM, a generic get-metrics API, faster health checks, benthos-umh 0.9.2 (with UNS plugins), and lots of reliability fixes.
- Upgrade via the Management Console to unlock the new converter flow.
- UMH Core - Coming soon
- Zero Kubernetes requirement — perfect for locked-down enterprise laptops or edge PCs.
- Built-in buffering with Redpanda, benthos (with over 50+ industrial connectors!), and the compliance features of the Management Console (Audit Trails, SSO, etc.)
- Runs happily on 2 vCPU / 4 GB RAM
0:00
/1:22
👉
Join our discord for latest updates on UMH Core: Link
- Native Ethernet/IP connectivity in benthos-umh
- Harvest live tag data from CompactLogix, ControlLogix, Micro800 (and more) and stream it directly through UMH’s high-throughput pipeline.
- One YAML file, one Docker run, and your plant telemetry is real-time-ready.
Learn more about this feature in this dedicated article.
Q1 2025
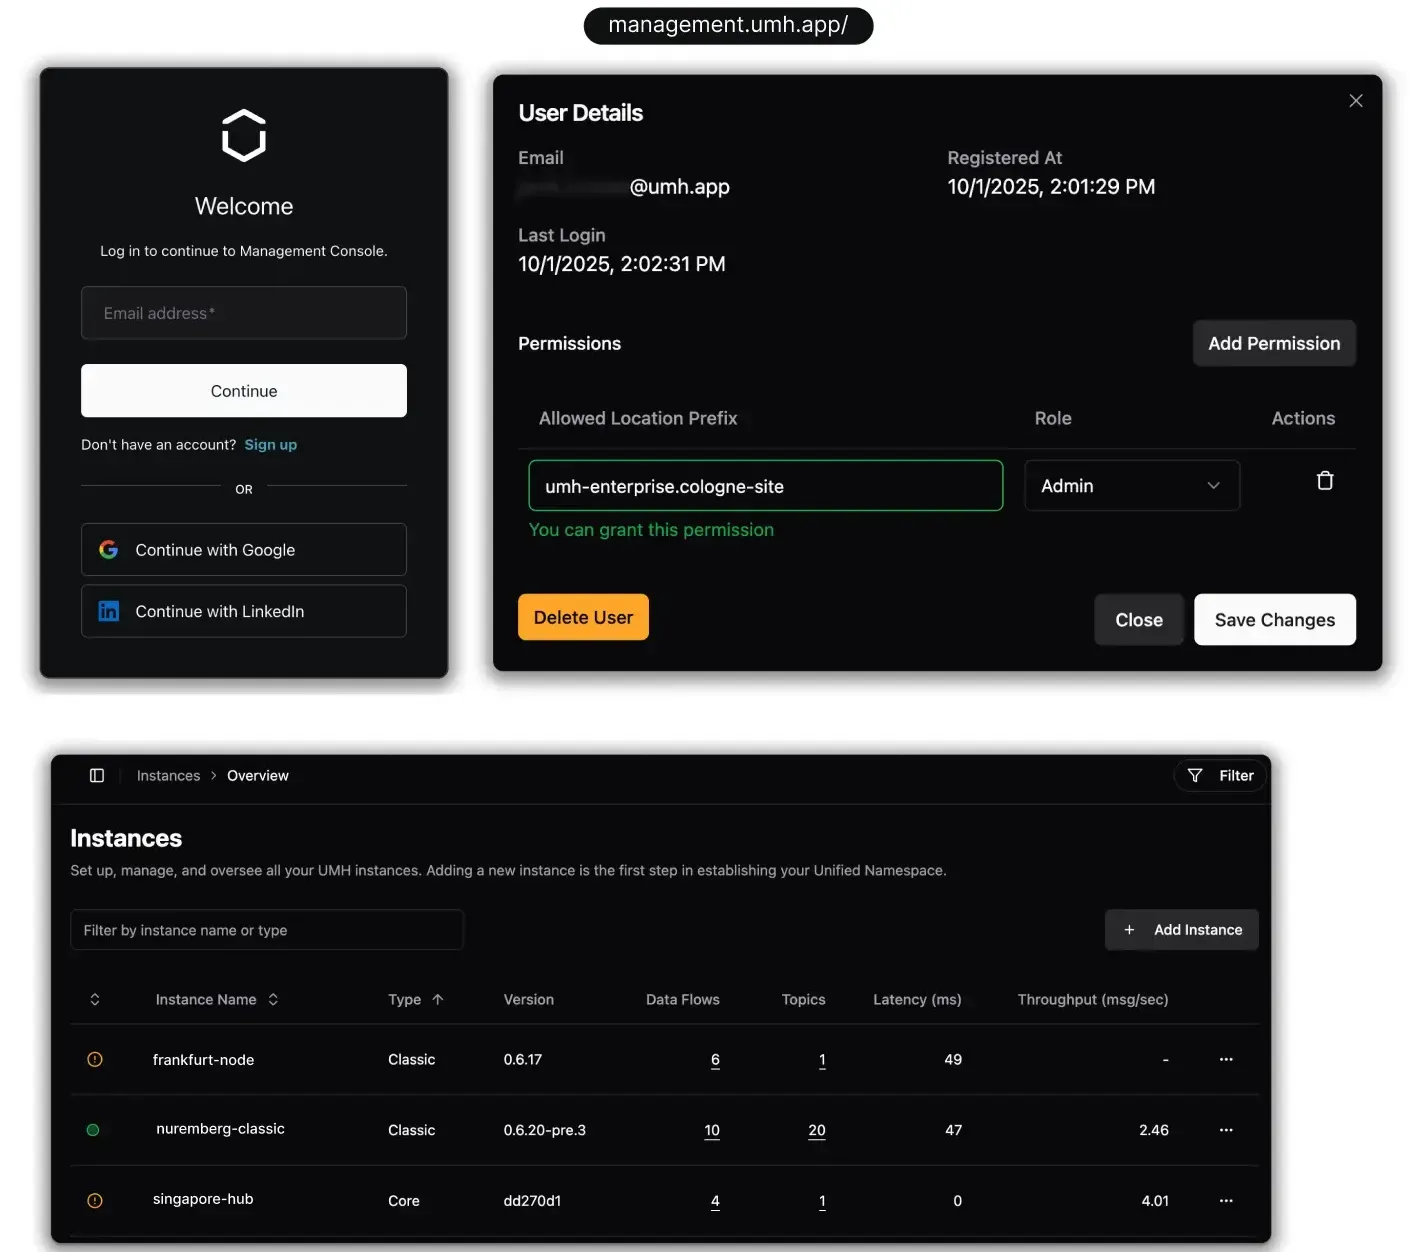
- Self-Service User Management: Enhances governance and control across your infrastructure.
- Introduces role-based access: Viewer, Editor, Admin, Super Admin.
- Define who can do what - fine-grained permissions via a permission matrix.
- Assign access per ISA 95 structure, limiting users to specific sites or areas.
- Simple onboarding: add name, email, assign role, define scope, and send invite.
- Available now in the Management Console for all enterprise users
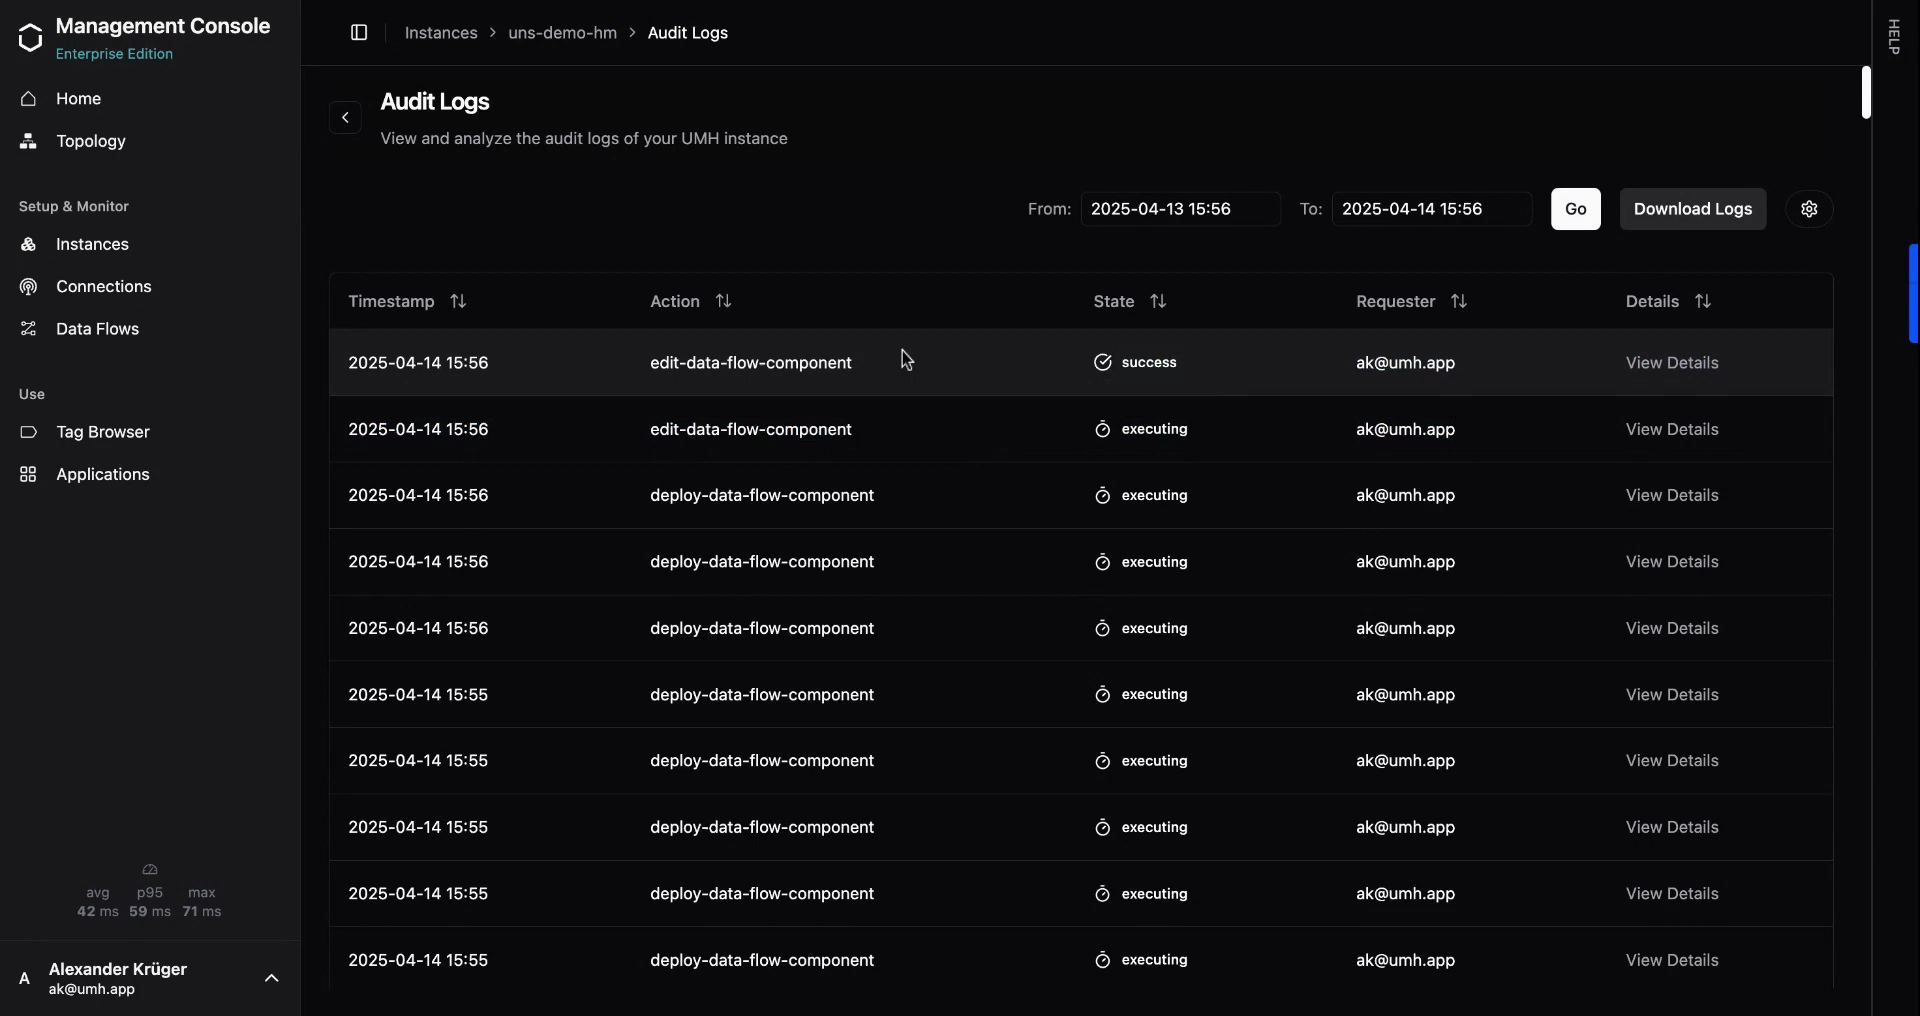
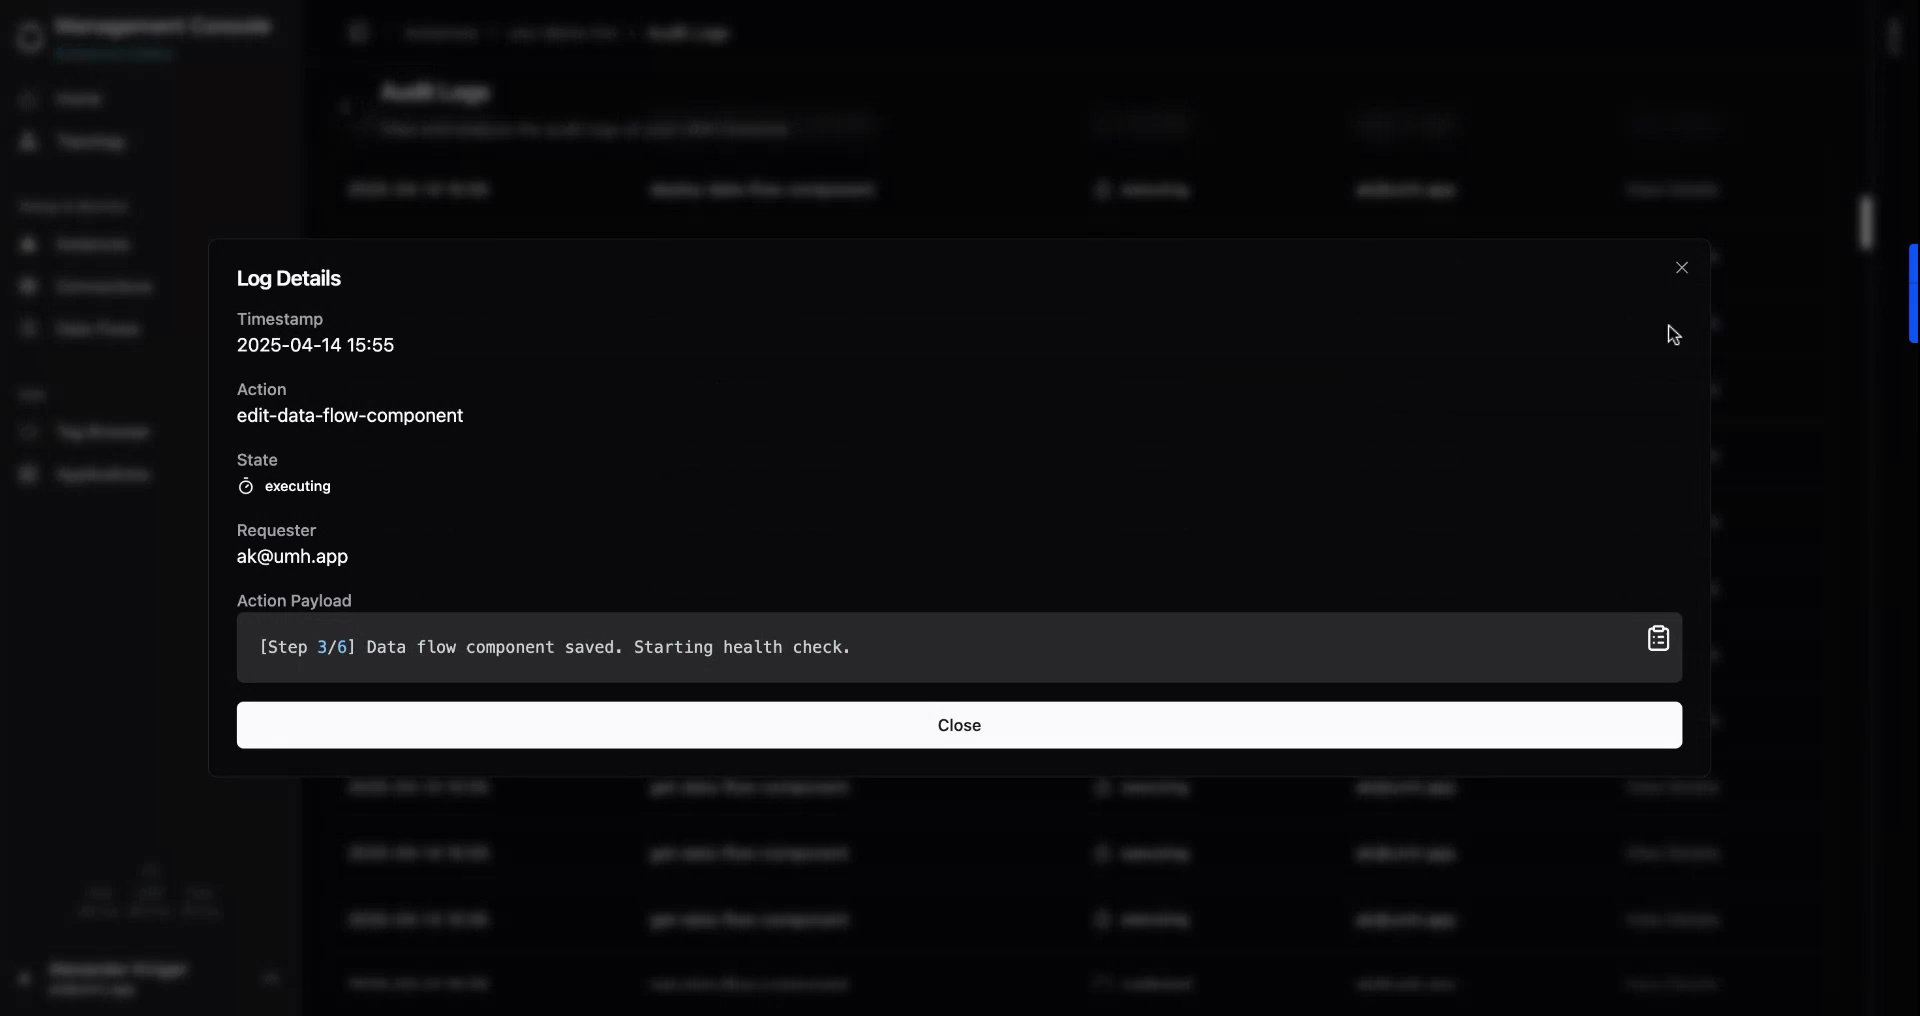
- Infrastructure-Level Audit Logs: Track every user action for full traceability
- Logs every action on your infrastructure: login, data fetch, edits, user changes.
- Works at the instance level, not just in the management console.
- Exportable logs for validation - ideal for regulated environments like pharma.
- Git Diff for Deployment Transparency and Collaboration
- Visual comparison between current and previous YAML versions.
- Shows exactly what changed, who did it, and when.
- Helps avoid deployment errors and improves team coordination.
- Great for scaling teams working on complex infrastructure setups
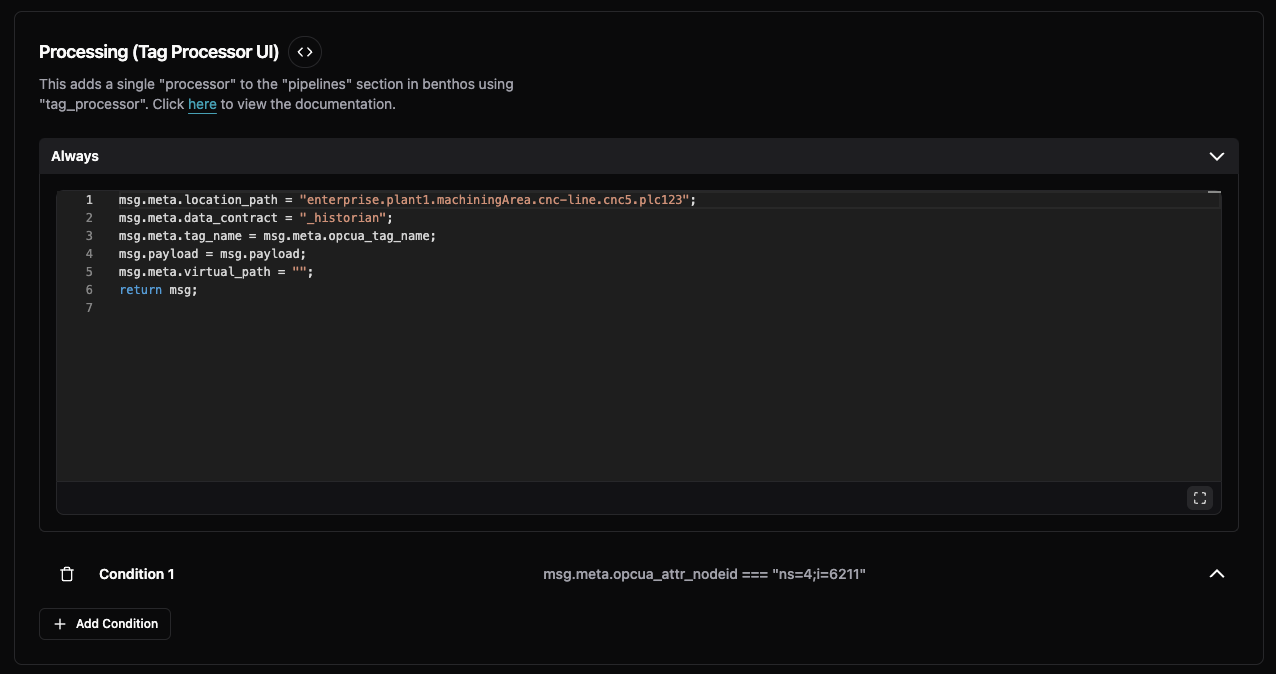
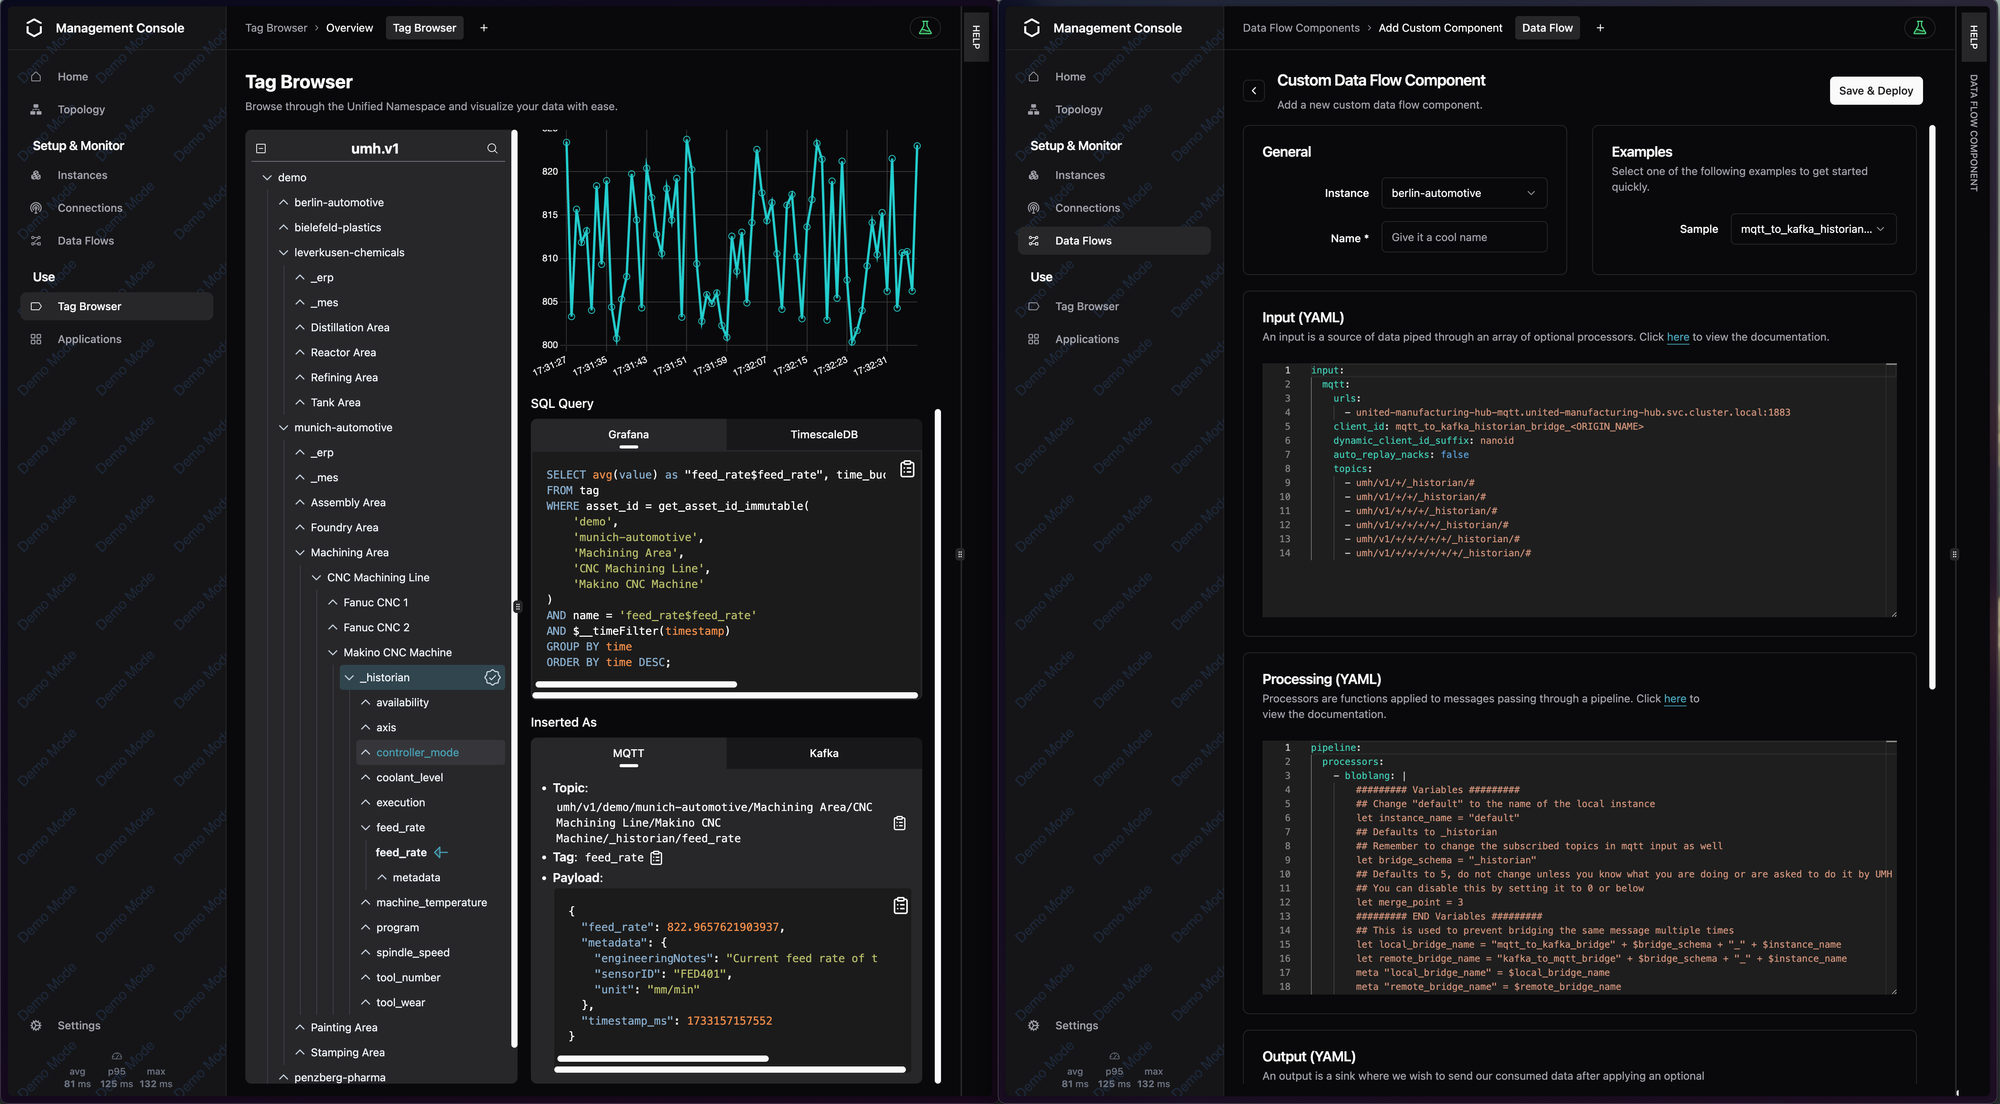
- Made processing of data human again - “Processing Mode” Overhaul
- ProcessingModeSelector: The feature flag for switching between Bloblang, Node-RED, Tag Processor, etc. is now enabled by default for all protocol converters. It was already announced in this blog post: https://learn.umh.app/course/node-red-within-benthos/
- When selecting tag_processor as processing mode, we have implemented a nice UI that makes it even simpler to configure the protocol converter (see screenshots)
- New Intuitive OPC UA Input Configuration UI
- Graphical OPC UA Setup: There’s a new dedicated UI for configuring OPC UA inputs—endpoint settings, advanced toggles, and auto-synced node IDs (see screenshot)
- Extended Node ID Handling: We fixed scenarios where comments or unusual YAML structures would wipe node IDs. The UI better preserves them, even if you have large or commented YAML sections.
- Install UMH in Existing Kubernetes Cluster
- User Choice: If you already have K3s running, the installer now asks if you want to skip re-installation. Handy for advanced setups where you just need to upgrade the Management Console or Helm charts.
- User Choice: If you already have K3s running, the installer now asks if you want to skip re-installation. Handy for advanced setups where you just need to upgrade the Management Console or Helm charts.
- Making the User Interface even more intuitive
- Enterprise License Display & Status
- A new “License Status” section shows if you’re using an enterprise license.
- If you already have an enterprise license, no upgrade prompts. If not, you’ll see an option to upgrade.
- Enterprise License Display & Status
- Enhanced style fixes and clearer license validity dates.
- Tag Browser Smart Auto-Expand
- Switched from width-based to height-based expansion.
- Provides a better initial overview when browsing large sets of tags.
- Global App Filtering
- A new “Filter” dropdown at the top helps you narrow data by location, instance, or other criteria.
- If nothing matches, a “No results—clear filters?” prompt appears for quick resets.
- Fullscreen Code Editor
- Edit large configs or code snippets without feeling cramped.
- Optional Bridge Headers (Kafka/MQTT)
- Properly displayed when using Kafka.
- Hidden when viewing MQTT to keep the interface protocol-specific.
- Making Benthos better for first-time & power users
- Test Benthos Config (Beta/Feature Flag)
- Directly test your Benthos input config in the Management Console.
- A dedicated button (behind a feature flag) lets you quickly iterate by running test inputs.
- Benthos Input Testing UI: Split-Pane Results
- Collapsible entries show payload, metadata, and errors clearly.
- No more cramped inline logs.
- Benthos Image Tag Customization
- Select a specific Benthos-UMH image tag in “expert mode” to test advanced or custom builds.
- Test Benthos Config (Beta/Feature Flag)
- Making OPC UA easier to use through browser enhancements
- Extended Timeouts (10s → 300s) for slow responses.
- Hierarchical Browsing toggle for servers with unusual responses.
- Improved Visibility with extra styling/borders.
- Retries if the root node is empty on the first try.
Other Improvements & Notable Changes
- Memory Usage & Performance
- Reduced Companion Memory: We introduced deeper caching optimizations and pointer-based data structures for Kubernetes watchers. This drastically cuts memory overhead if you have many secrets, configmaps, or pods.
- Retry & Backoff: Various fetch operations (companion version checks, instance polling, Helm re-checks) now automatically retry on transient network issues or DNS hiccups.
- Enhanced “DFC Rollback”
- We remove resourceVersion in configmaps/secrets before attempting a rollback, making rollbacks more reliable and less prone to conflict errors.
- UMH Instances Polling
- Split the instance data fetching vs. message processing into two separate steps, so the UI can show partial updates faster. Especially noticeable when you have many instances or slow networks.
- Auto-Scroll & Split Pane UI
- Log Auto-Scroll: The log viewer only auto-scrolls if you’re at the bottom, so it won’t jerk back down if you’ve scrolled up.
- Split Pane Scaling: Fixes for collapsed states and weird alignment issues, especially when toggling the left panel in code editors.
- DNS Handling / IPv4 Enforcement
- The installer now checks if DNS recursion is available over IPv4. If not, it prompts you for alternative DNS servers, preventing certain “DNS misbehaving” errors on hosts like Hetzner.
- Helm & Installer
- Limit Helm Revisions: We added MaxHistory=5 and CleanupOnFail so the cluster doesn’t accumulate hundreds of old Helm secrets.
- Atomic Installs: Ensures that a Helm upgrade either completes fully or is rolled back, reducing partial-install headaches.
- Go Version Bump
- Updated internal build environment from Go 1.23.x → 1.24.x, offering better performance and some updated language features.
- Performance & Stability
- Raised default QPS & Burst for high-throughput (50k tags/sec!)
- Better concurrency handling and faster simultaneous downloads.
- SQL Query Resolution Selector
- In the Tag Browser’s SQL tab, choose different time resolutions or raw data.
- ActionErrorCollapsible for DFCs
- A top banner shows consolidated error messages for easier troubleshooting.
- Duplicate Deployment Checks for DFCs
- Prevents multiple DFC deployments by the same connection ID.
- License Box Style
- Cleaned up styling on the homepage for consistency.
- Svelte Dependencies
- Removed
svelte-chartjsin favor of direct Chart.js for a smaller bundle.
- Removed
- Refined Applications & Instances
- Improved IP display (real names + statuses).
- Instances show Management Companion version (not just Helm chart version).
- Added fallback sorting by UUID for stable listings.
- Auto-Scrolling Log Boxes
- Always see the latest log messages without manual scrolling.
- Rocky Linux Auto-Update
- Enforces certain minor versions and auto-updates for better security.
Q4 2024
- User Experience Enhancements
- Making SQL Queries Even Easier to Build with the Resolution Selector: The Tag Browser now includes a resolution selector that shows available options like $__interval, 1 hour, 1 minute, and 1 second, improving query flexibility.
- Sample library to push data from the UNS to other applications : A protocol dropdown list with a wide array of data sinks and sources has been added when creating custom data flow components to simplify the configuration.
0:00
/0:36
SQL Query Resolution Selector
- System and Performance Improvements
- Enabling the companion to check the disk health: The Management Companion now verifies instance stability and disk availability before upgrading to prevent potential failures.
- Experience the UMH is now even easier with more sample data: We expanded the Demo Simulator to cover more verticals, addressing a wider range of use cases and sample industries.
- Multitask with multiple tabs with the Management Console
- We understand that there are multiple workflows where you want to "model your UNS data"; therefore, we added the ability to open multiple tabs simultaneously.
- This gives the user the ability to more easily copy and paste between processing steps and also monitor the data going through the pipeline, among other things.
- As a nice side effect, the management console also got way faster due to the underlying technical changes
- Better reliability and parsing in benthos-umh
- Fixed a bug in sensorconnect that resulted in "hanging up" after some time (thank you, @EmlingerM!)
- Fixed a bug with sensorconnect where octetStrings were not properly parsed
- Cleaned up the module imports (chore)
- Management Companion updates
- Fixed a bug where on some systems k3s would fail to start due to misconfigured fs.inotify.max_user_watches and fs.inotify.max_user_instances
- Added stricter instance name validation, preventing invalid k3s node names
- Added automatic recovery for stuck Helm upgrades by attempting to rollback to the new version after 5 minutes
- Offloaded some of the processing in the frontend to a dedicated worker, resulting in better reactivity
- Fixed a bug where upgrading from old Helm charts would sometimes fail
- Added more machines to our demo simulator
- Added release channels and dedicated enterprise channels
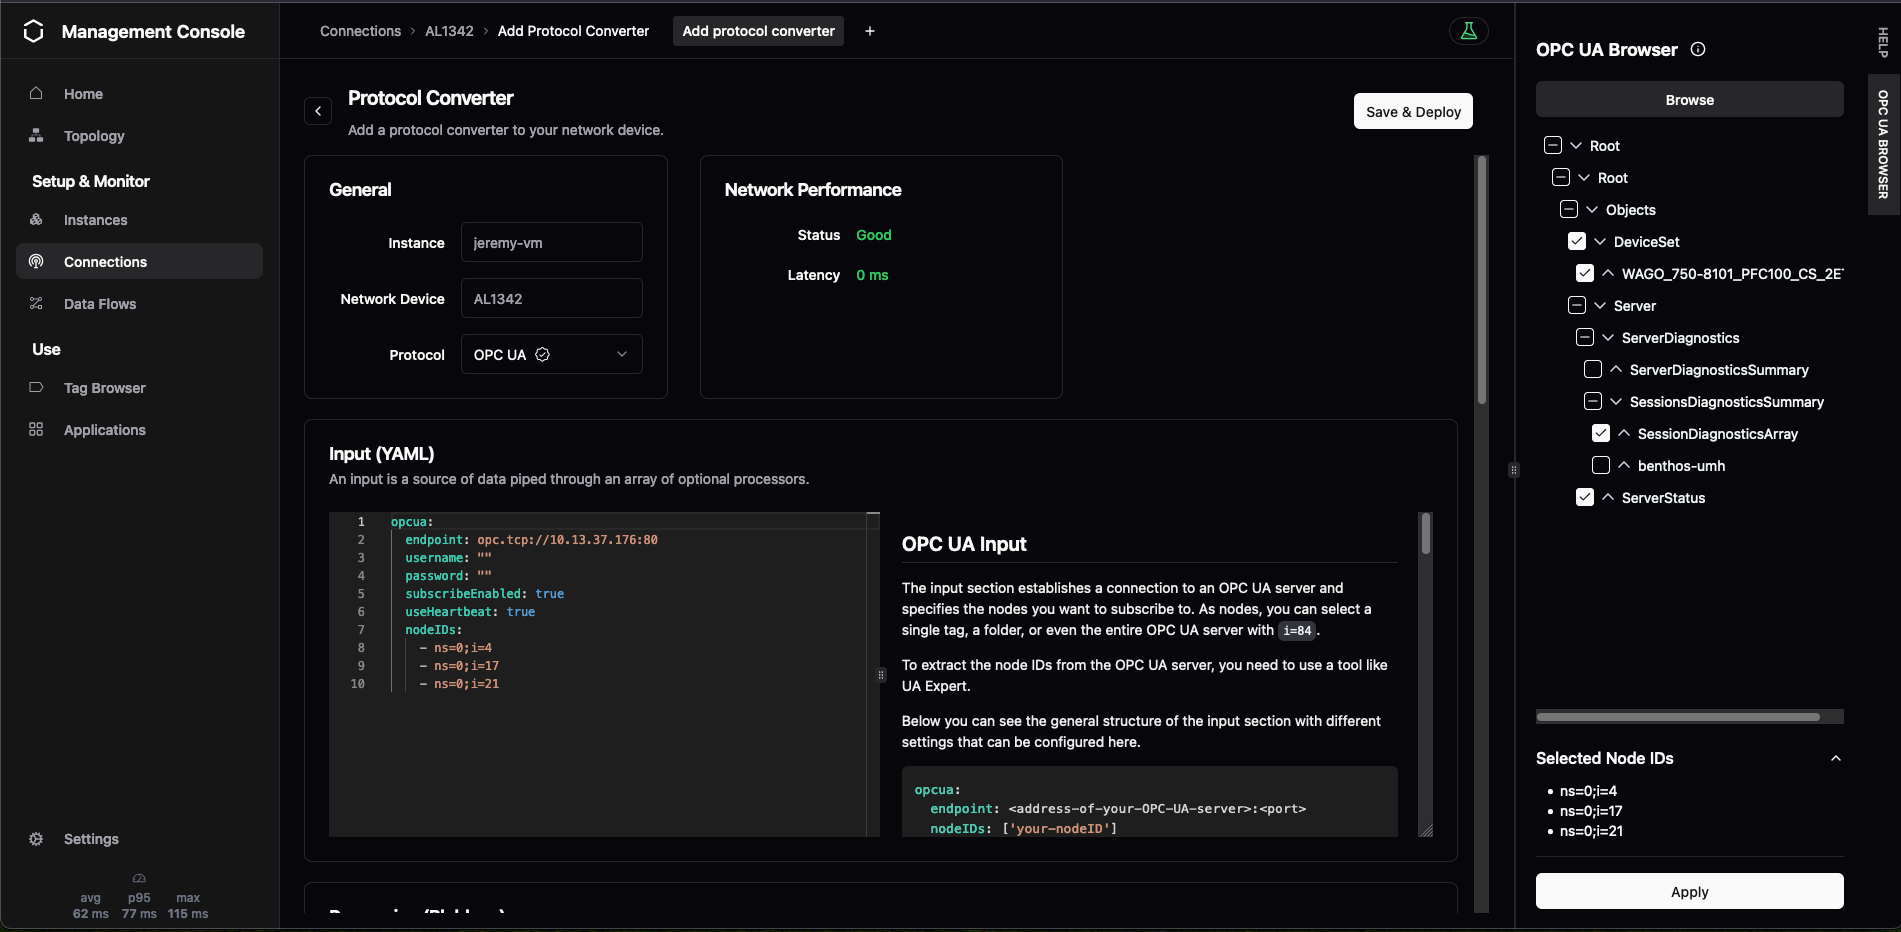
- Streamline Data Discovery on OPC UA Servers with Our OPC UA Browser
- We have added to our Protocol Converter feature in the management console the ability to browse and explore the configured OPC UA Server
- This makes it much easier to actually see which data points are available and which are not, thereby reducing the time to value per new OPC UA Server
- You can select a set of folders or individual nodes and apply those directly to your input YAML to streamline the workflow even further.
- Connect IO-Link with the UNS and UMH
- You can now use IO-Link sensors to enrich the UNS with tactical process and production data like temperature sensors, light barriers, or vibration data through the plugin in the protocol converter
- This reduces time spent on additional middleware by connecting directly to the sensor and gateway
- It automatically parses the hex-encoded sensor data from the IO-Link Master with the corresponding IODD files to create a human-readable JSON with all values in key-value format
- All data points are then available in the tag browser and are automatically persisted in the database
- New Benthos-based bridges and fully Automated Helm Upgrade from the Management Console
- We have now ported all our internal bridges (e.g., MQTT -> Kafka, Kafka -> MQTT) to Benthos-based DFCs to increase performance, maintainability, and directly make features like logs and metrics available in the management console
- The Upgrade button has now become even more powerful! Now, not only does the management companion get updated from the management console, but also the attached Helm chart of the UMH, making upgrading and staying up to date even easier
Q3 2024
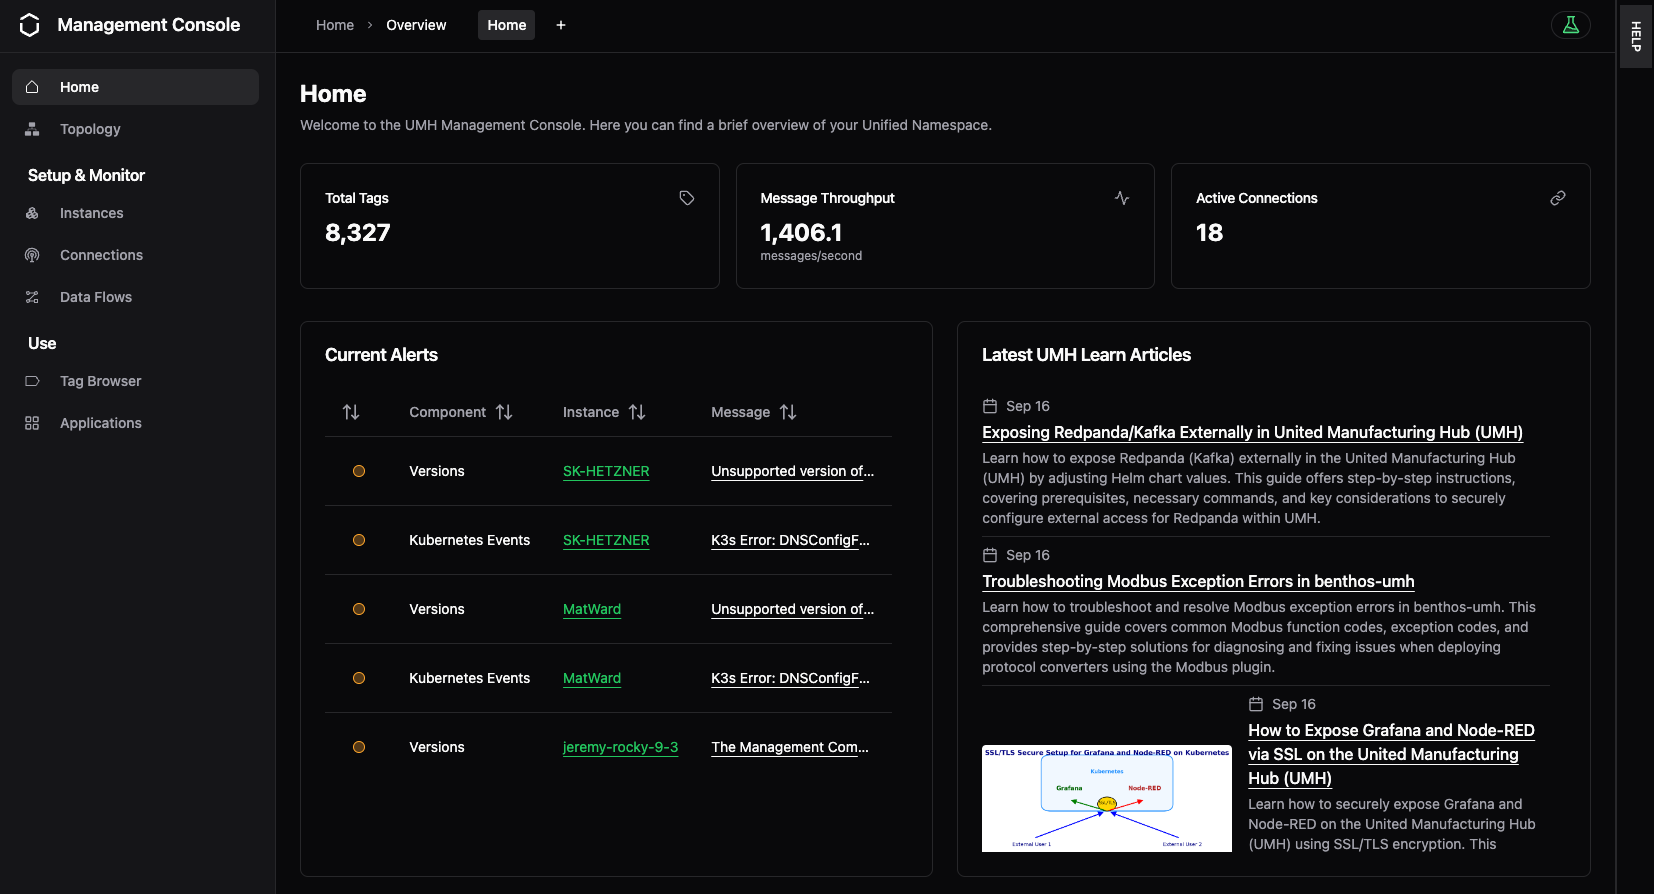
- New Homepage and small UI rework
- We have added a new homepage that now displays relevant usage KPIs such as tags captured, current throughput, and connected interfaces. It also includes a list of alerts for your entire deployment that require your attention.
- Additionally, a list of the latest UMH blog posts is now available to help you learn about or improve your deployment.
- Help pages are now accessible via a side panel that you can slide in on relevant pages to assist you in navigating quickly.
- Templates for DFCs to help you bridge data more easily
- Introduced new custom Data Flow Control (DFC) templates for
kafka-to-postgresand other bridges. This preview feature allows you to store your own data in the database or bridge your custom data contracts between MQTT and Kafka.
- Introduced new custom Data Flow Control (DFC) templates for
- Easily Upgrade Your OS via the Management Console
- A clear upgrade path for Flatcar and Rocky Linux has been implemented. Users will now receive detailed messages explaining why a version is outdated, along with guidance and an easy command to update.
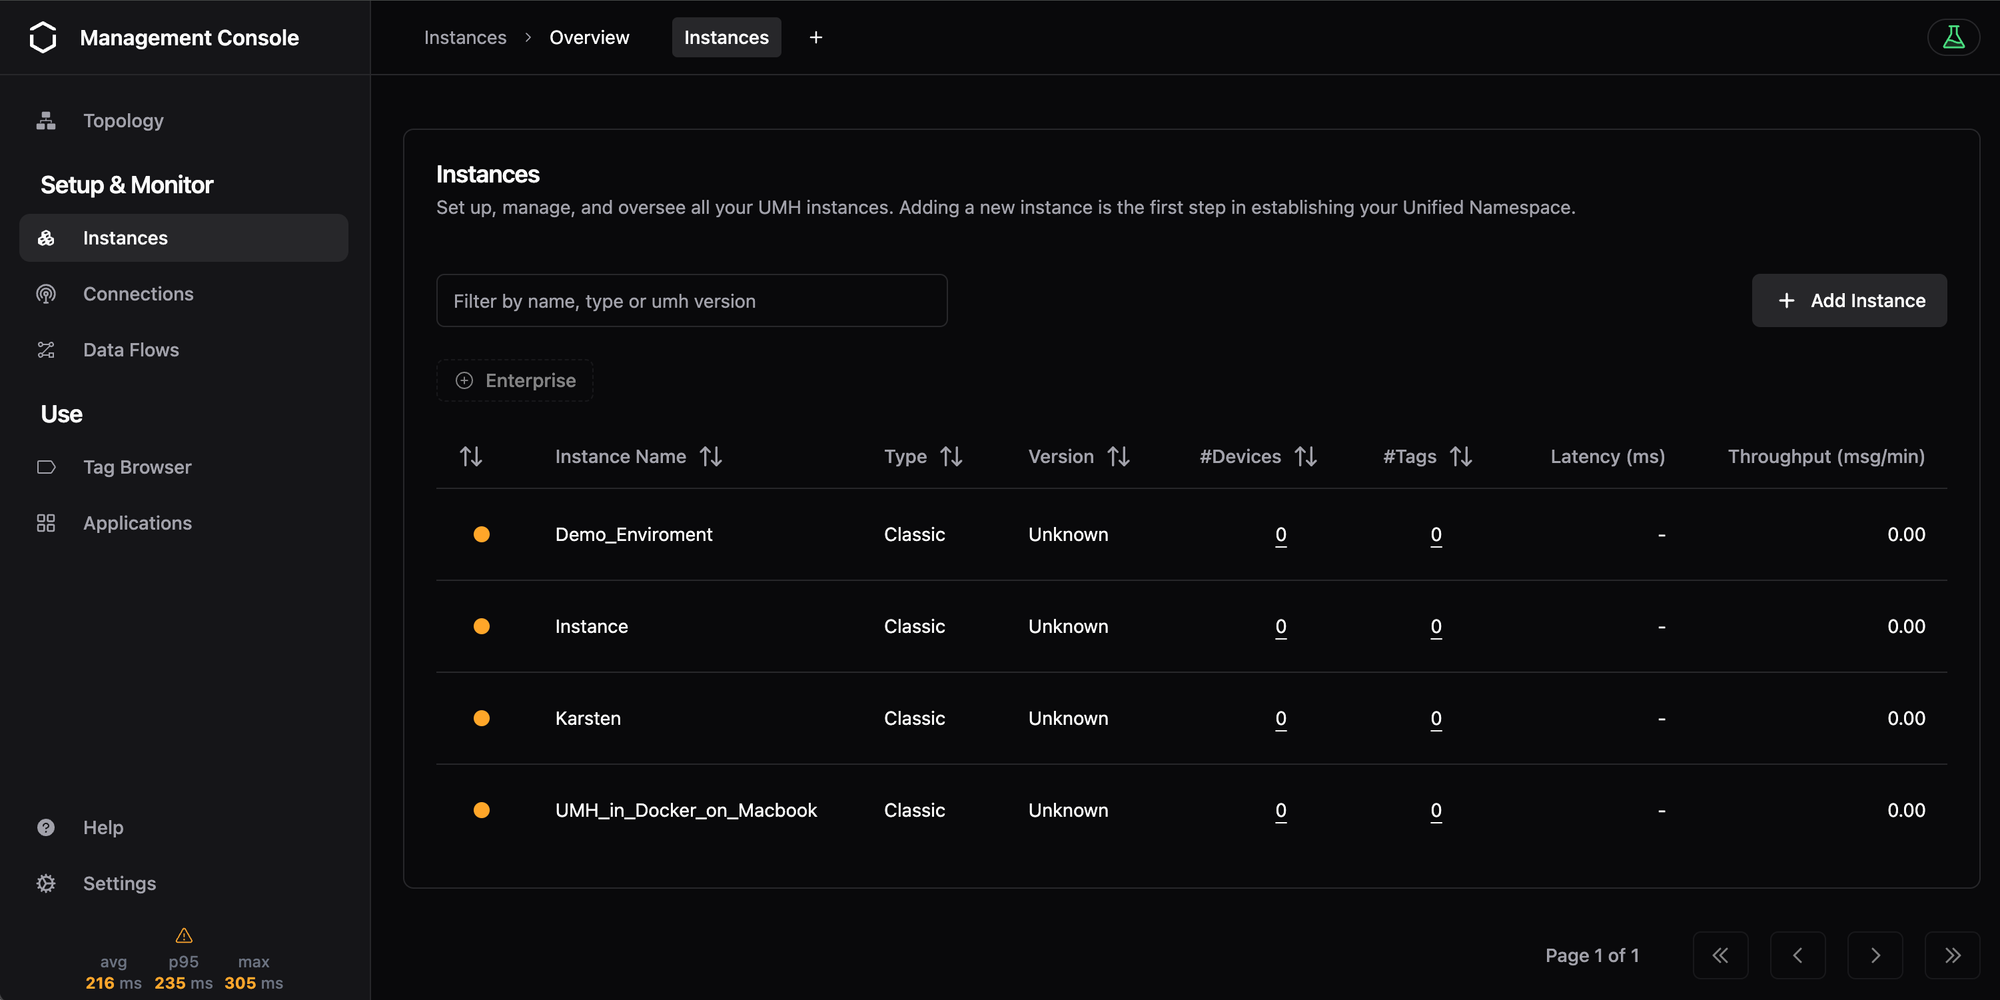
- New Instance View and Tab feature: The new Instance view replaces the old Component View and increases amount of visible information and improves the ability for non technical users to use & troubleshoot the infrastructure.
- Data Flow Components: We’ve enabled the deployment of fully custom Benthos setups to make all Benthos use cases available through the Management Console. We also included a template, e.g., mirroring the UNS to AWS SQS, - more to follow soon.
- Released Modbus over TCP/IP Connector for Benthos-UMH: Added the ability to connect to devices via Modbus over TCP/IP e.g. energy meters, which is fully end-to-end tested against a Modbus simulator. Additional documentation is available here.
- Integrated Protocol Converter into Data Flow Components: Protocol converters are now deployed using the same mechanism as custom data flow components, improving reliability and enabling version control and rollbacks.
- ARM64 Support for UMH Lite: Initial support for ARM64 is available for UMH Lite deployments, increasing accessibility for ARM-powered devices for data capture. UMH Classic will follow at a later time.
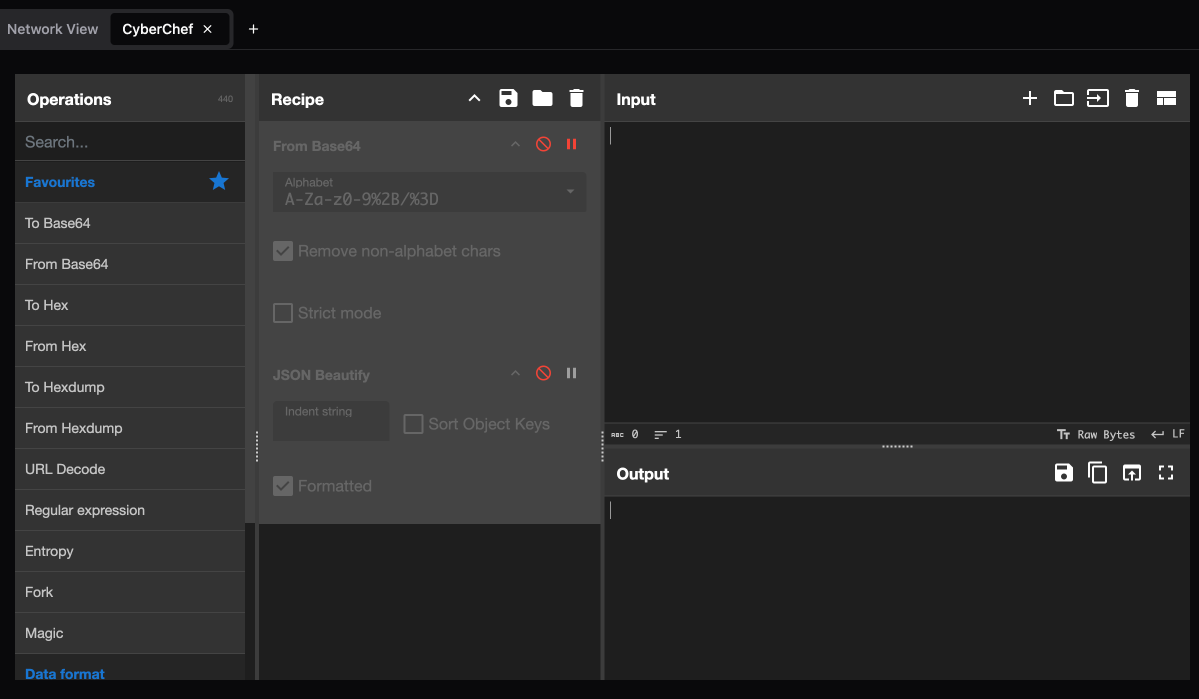
- Included CyberChef / Quick data conversion: We’ve integrated the popular tool "CyberChef" for simple and complex data manipulation, such as decoding Base64 or Hex payloads. It's available for every data point in the tag browser.
Browse our Discord for real-time updates on releases, updates, improvements, and much more!!