

I’m Mateusz, and before joining UMH, I spent several years at McKinsey driving digital transformation projects in manufacturing. In my current role, I help companies get the most out of their production data and optimize processes. Alerts are a key part of that strategy, helping to minimize downtime and quality issues by pointing out problems exactly when they arise.
Every minute of unplanned downtime can cost thousands of dollars. So how do you catch issues early when a machine or process value starts going off track? With Grafana Alerts, you receive critical notifications in real time, along with direct links to the relevant dashboards—so you can take action before serious problems occur. Since version Grafana 9.0 its difficult to setup alerts for beginners so this article provides an intro on the basics and how to setup email and Microsoft Teams notifications.
Why Alerts in Grafana?
Grafana allows you to handle your entire monitoring workflow—dashboards, data queries, and alerting—in a single tool.
- Linked Information: Alert notifications include direct links to dashboards for deeper analysis.
- Central Management: Alerts, contact points, time schedules, and escalation levels can all be managed in one place.
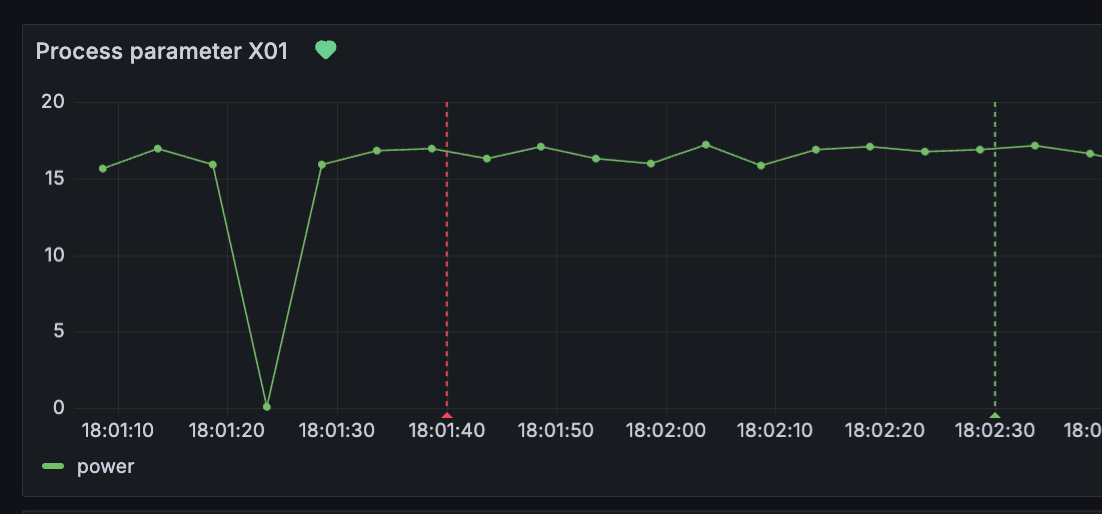
- Better Visualization: Graphs can display colored markers showing when alerts were triggered and resolved, making it easy to see exactly when issues occurred.
Since version 9.0, Grafana has fundamentally reworked its alerting features. The new approach scales better but is also more complex to set up. This tutorial walks you through the crucial configurations—especially for industrial scenarios (Monday-to-Friday production, separate maintenance and production teams, weekend pauses, etc.).
Requirements & Example Scenario
In our example production line, operations run Monday to Friday. A critical process parameter determines whether a machine is functioning normally or needs maintenance. If it falls below a certain threshold, maintenance technicians should be notified first; if the issue persists (e.g., for 30 minutes), then the production manager should also receive an alert. On weekends, alerts should automatically be paused to avoid spam. We’ll set up both email and Microsoft Teams as notification channels.
The Three Core Steps in Grafana Alerting
Trigger Function (Defining an Alert Rule)
Creating a new alert
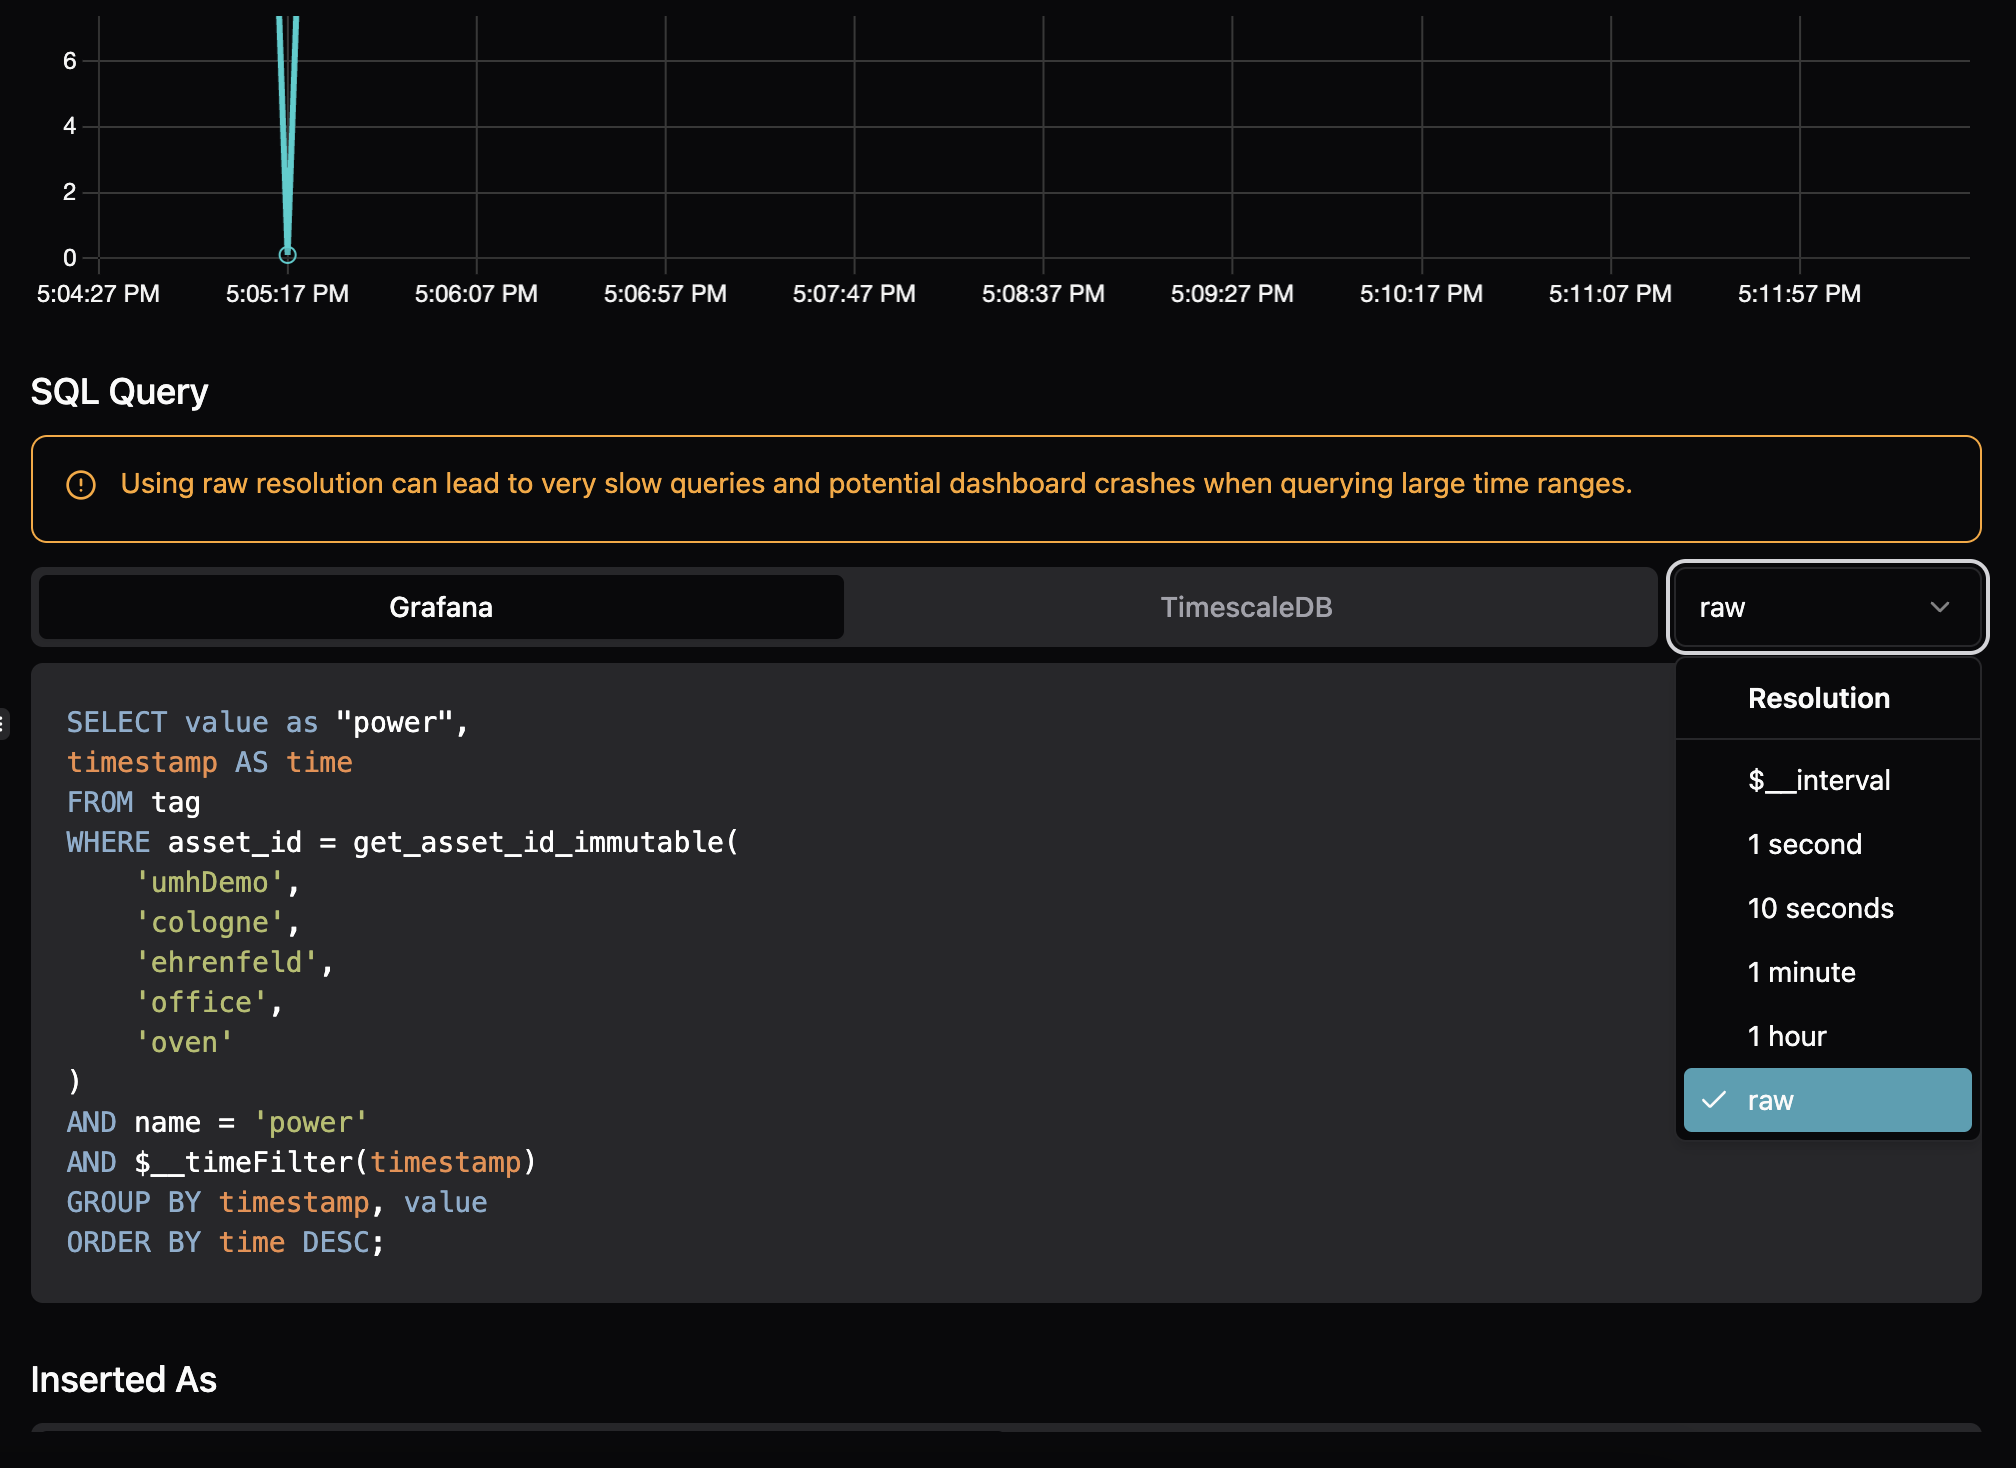
- Open the management console to select the correct tag or relevant data point.
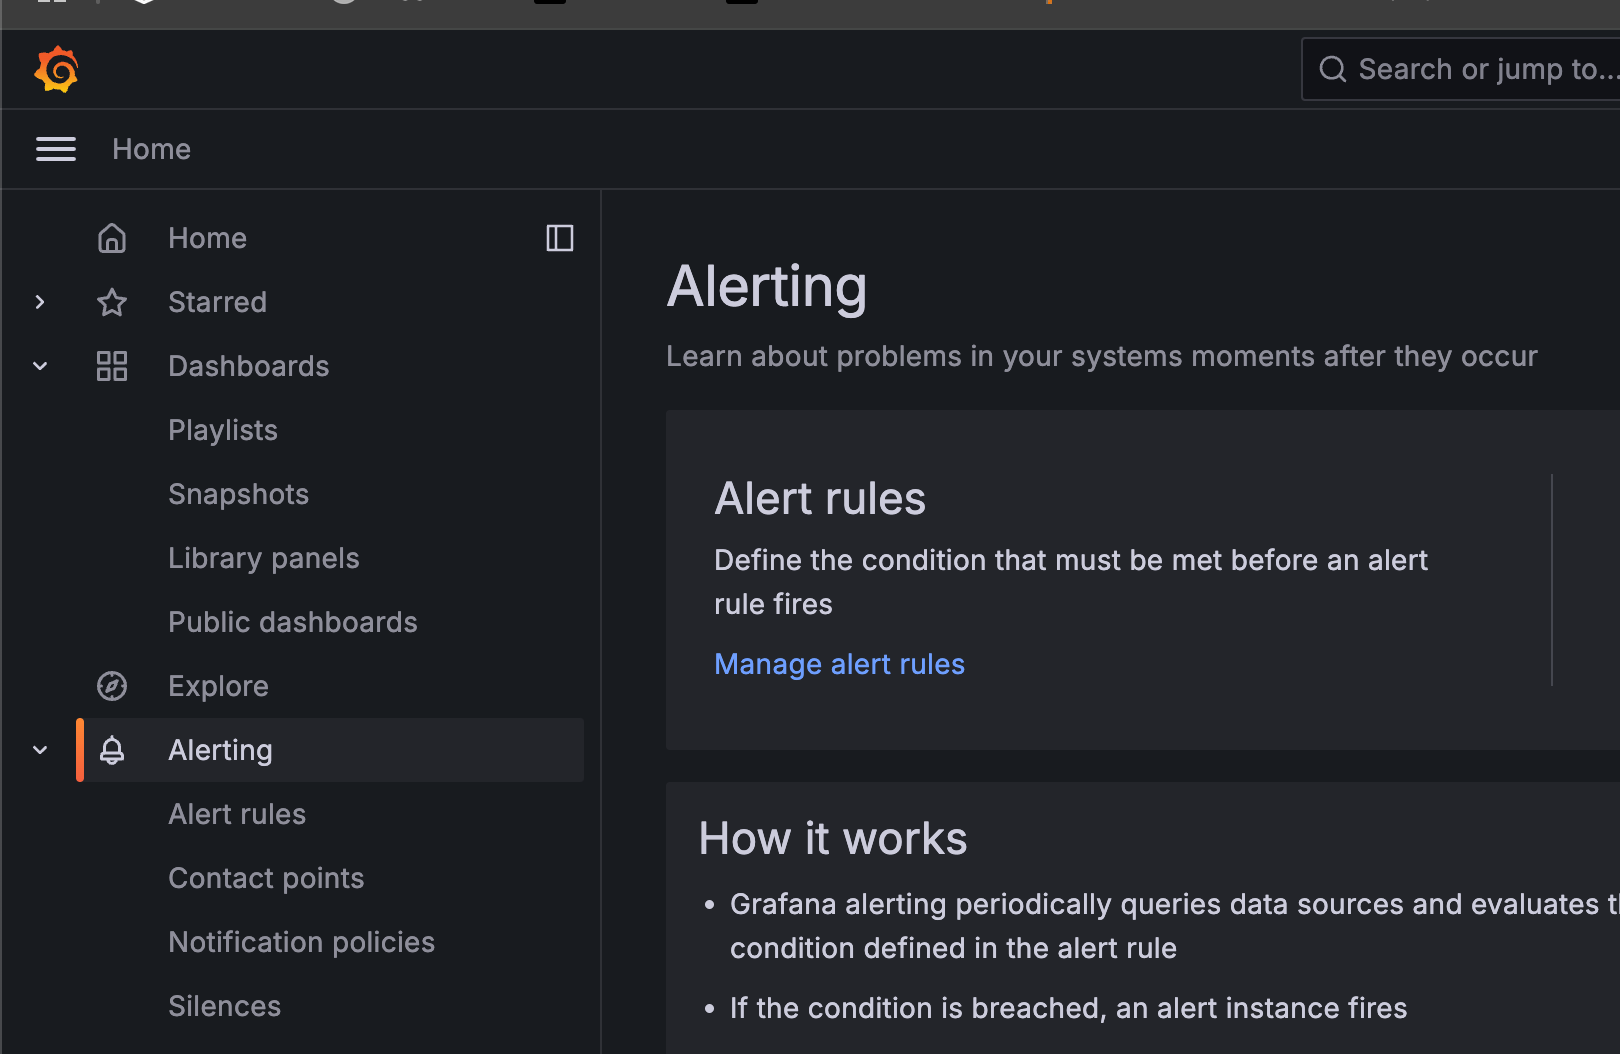
- Go to Grafana → Manage alert rules (left menu, bell icon).
- Create a new alert rule, give it a descriptive name, and paste your SQL query into the “Code” field.
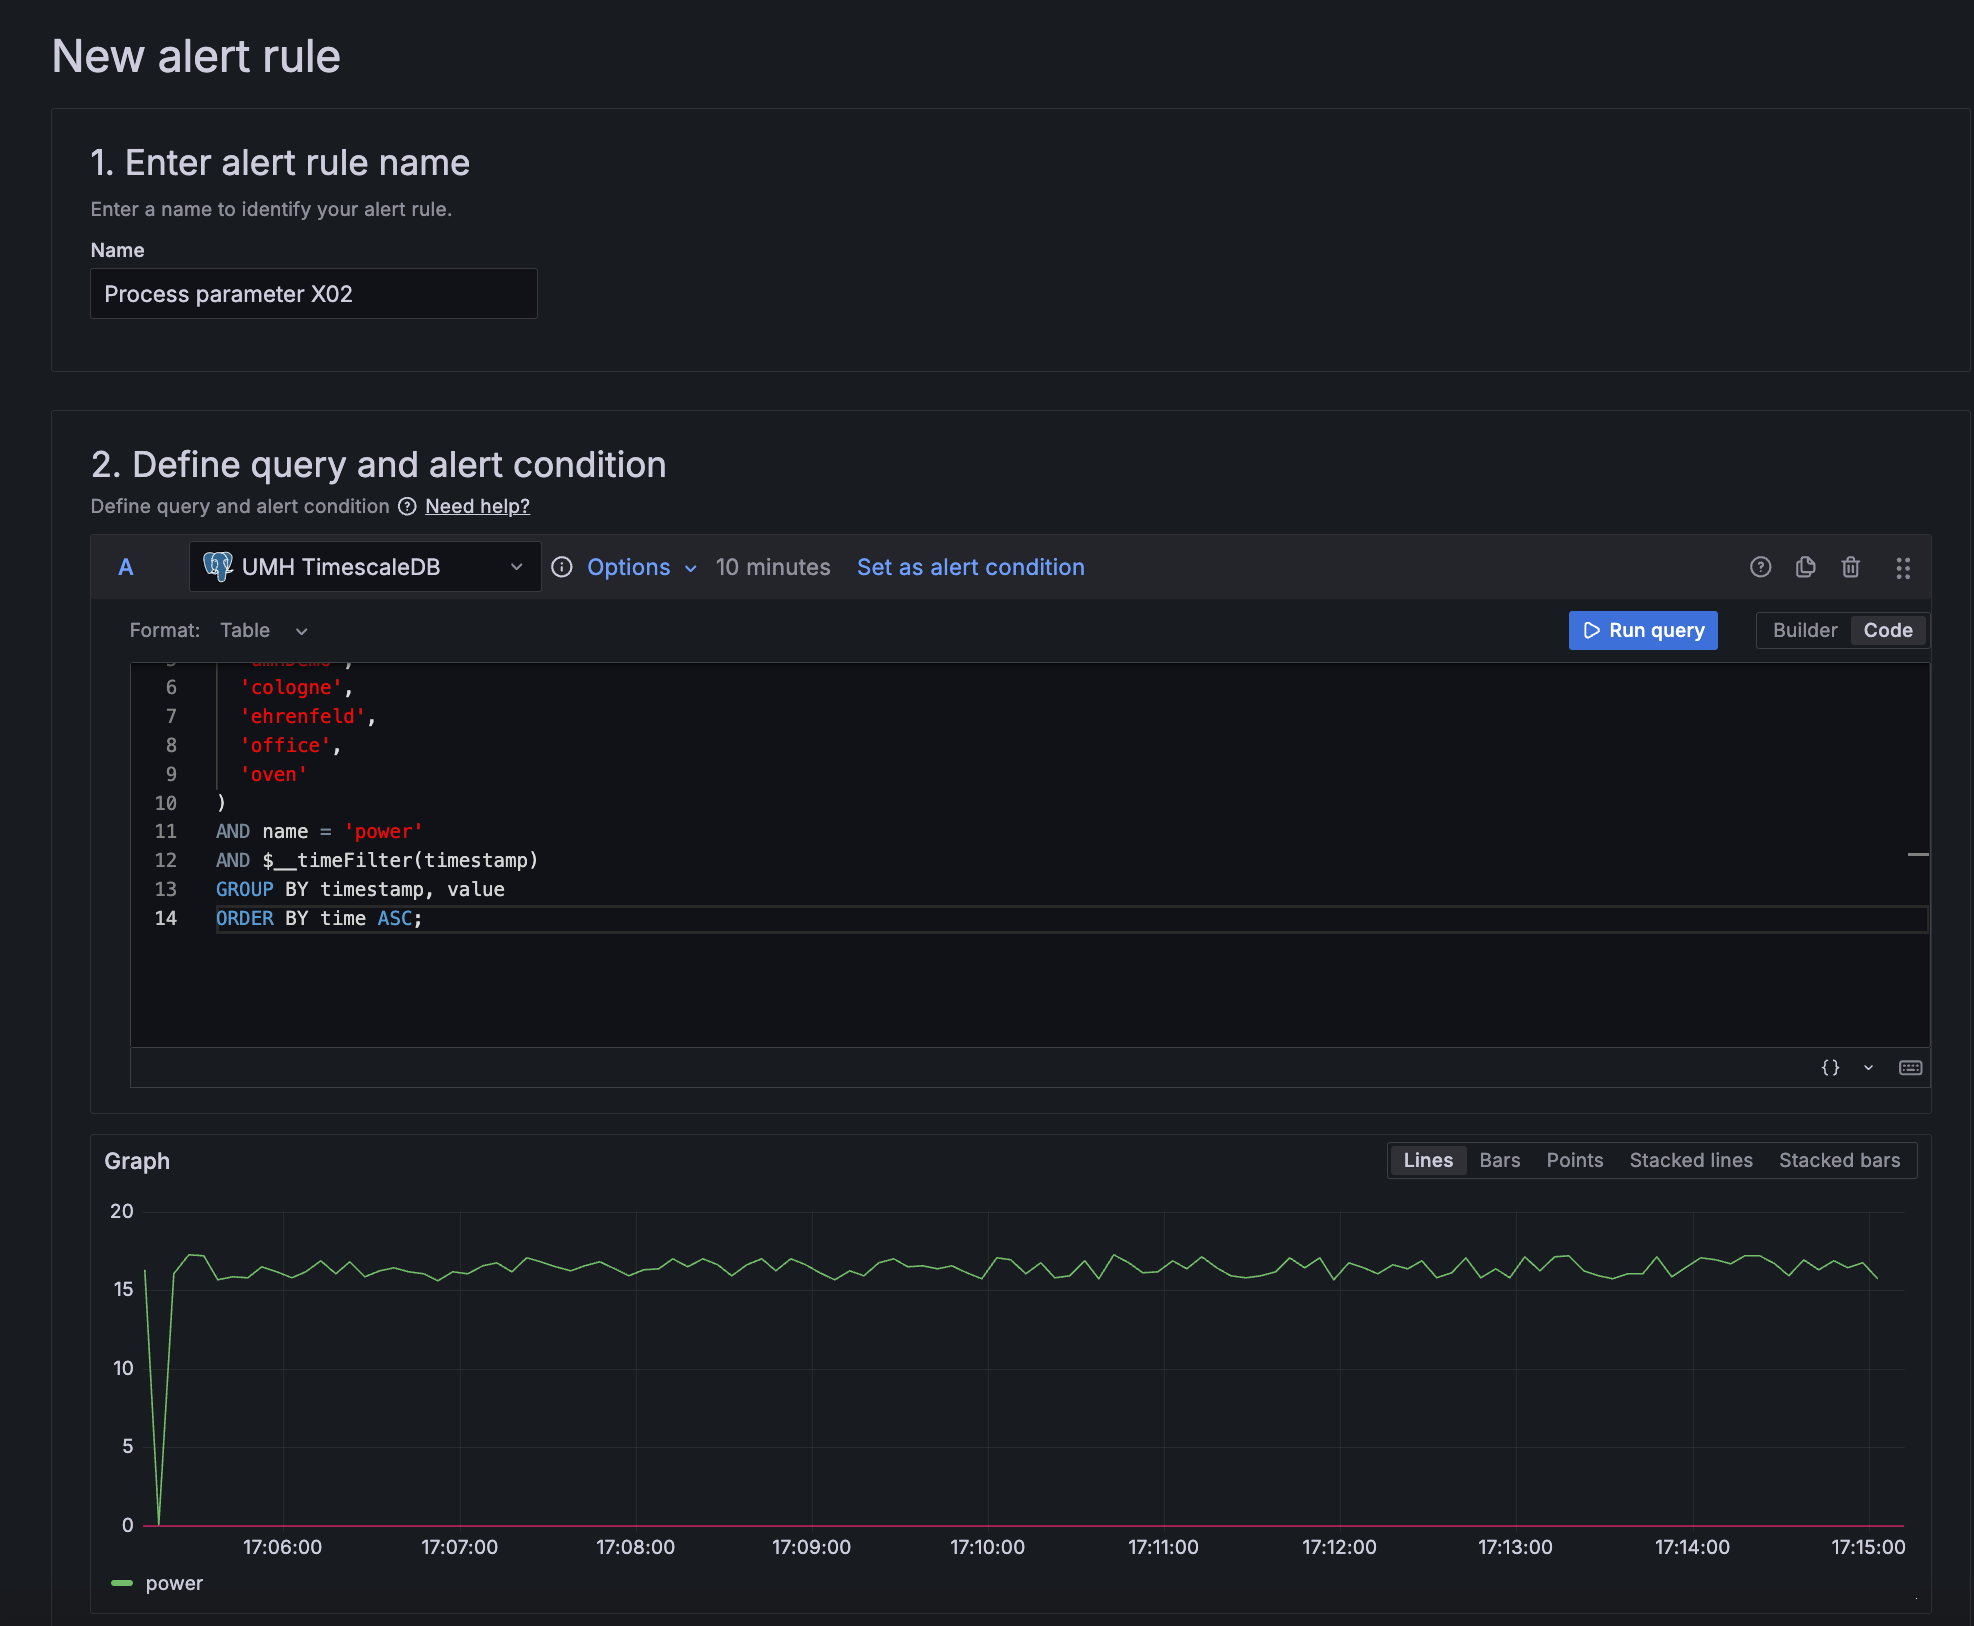
Define the alert condition
Grafana lets you process the queried data further:
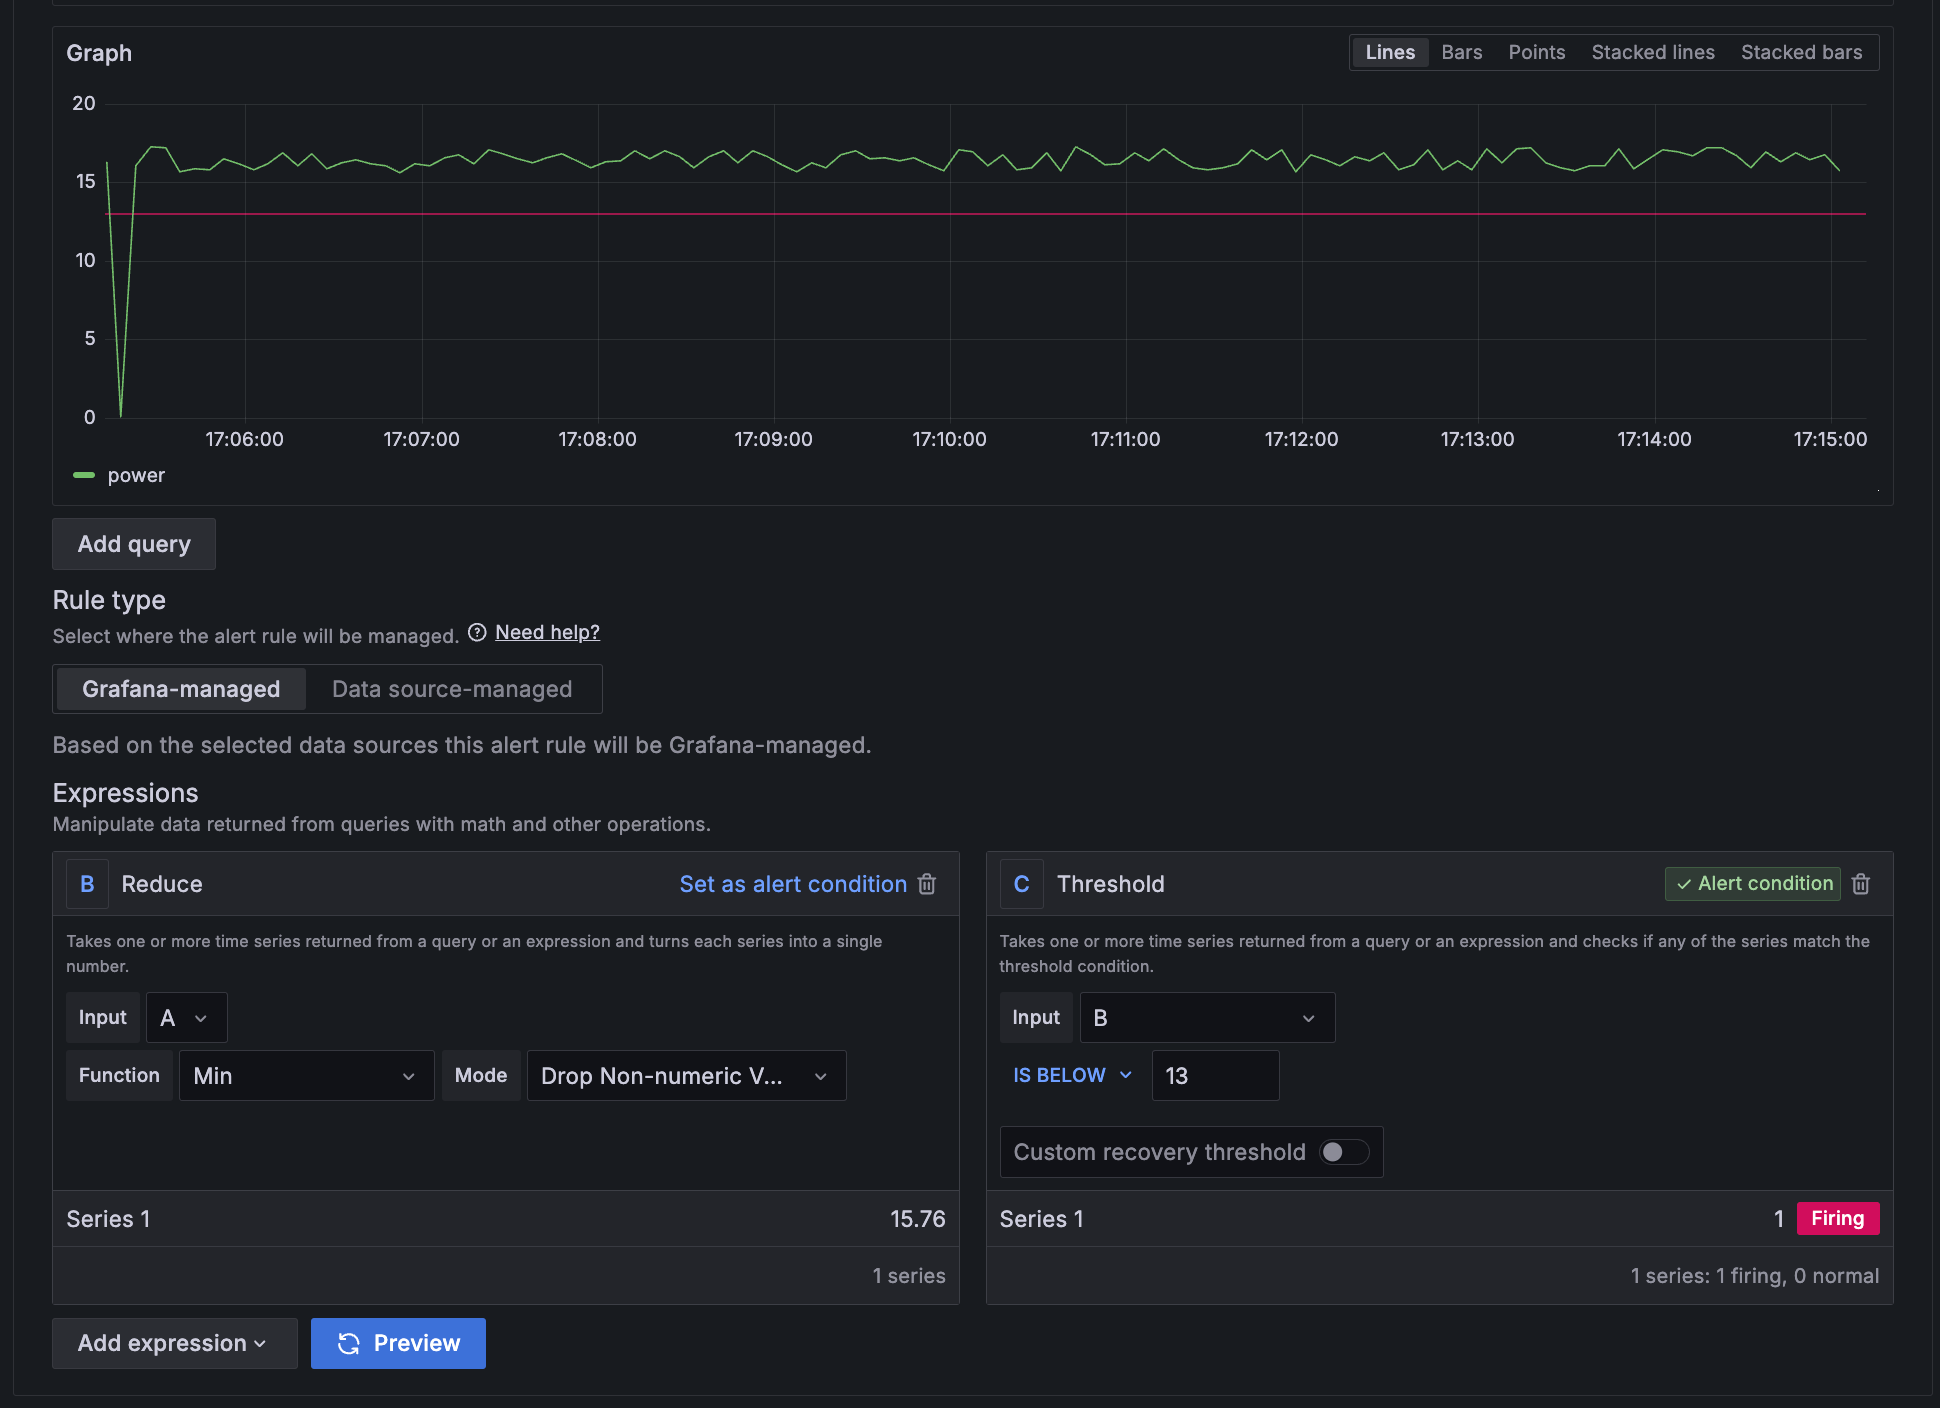
- Reduce function (e.g.
MIN,MAX,AVG) - Threshold or Math expression to decide when the alert should fire
In our example, we set the threshold (which is our alert condition) at 13. As soon as the process value drops below 13, the alert is triggered. You can use the “Preview” button to verify that the alert behaves as expected.
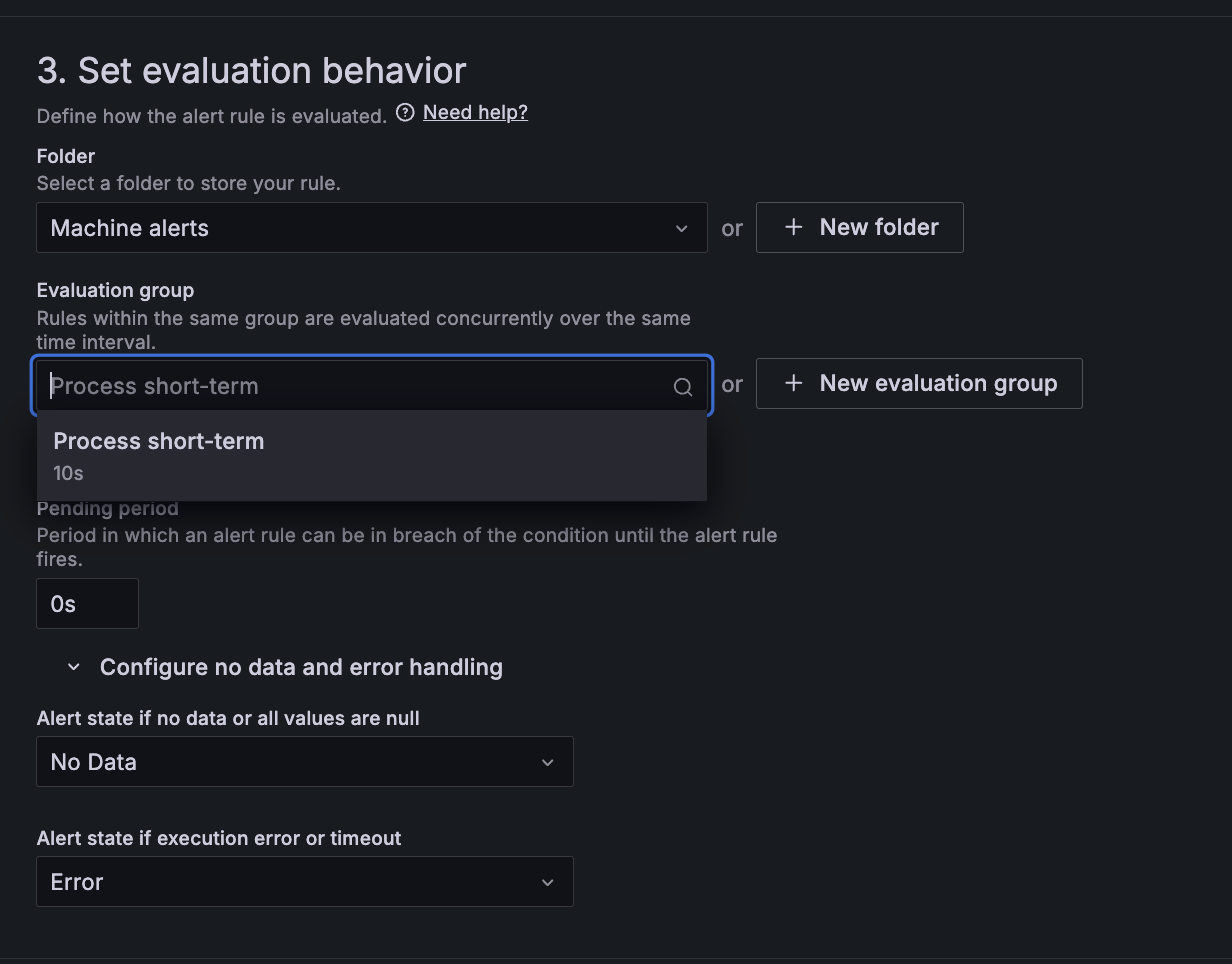
Evaluation Interval & Pending Period
- Evaluation Group: Choose or create a group (e.g. “MaintenanceAlerts”) and specify how often Grafana runs the query (e.g., every 30 seconds, every 1 minute, etc.).
- Pending Period: Defines how long the condition must be met before the alert officially enters “firing.” For quick maintenance response, you can set this to 0s or just a few seconds.
Performance Tip: Shorter intervals = higher system load. Choose a balance that fits your needs.
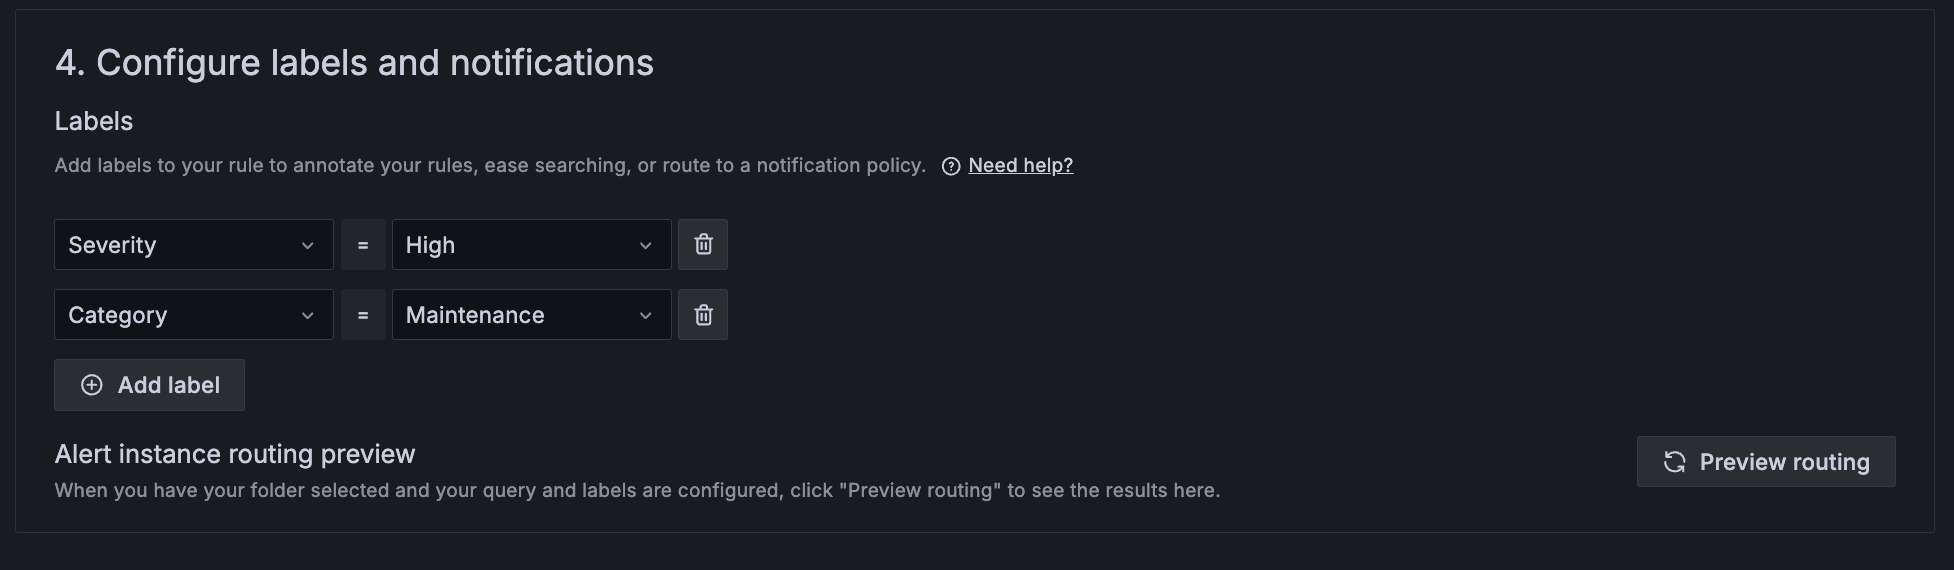
Labels
Labels are custom flags or topics to which the notification policies are subscribing (later process step). The maintenance team might be interested in receiving all notification which are under “Category = Maintenance”, the operators in “Category = Production” and the production manager in all labels with “Severity = High”.
- Labels: Tag your alerts (e.g.
Category=maintenance,Severity=high) or by location (Factory=cologne).
Annotations
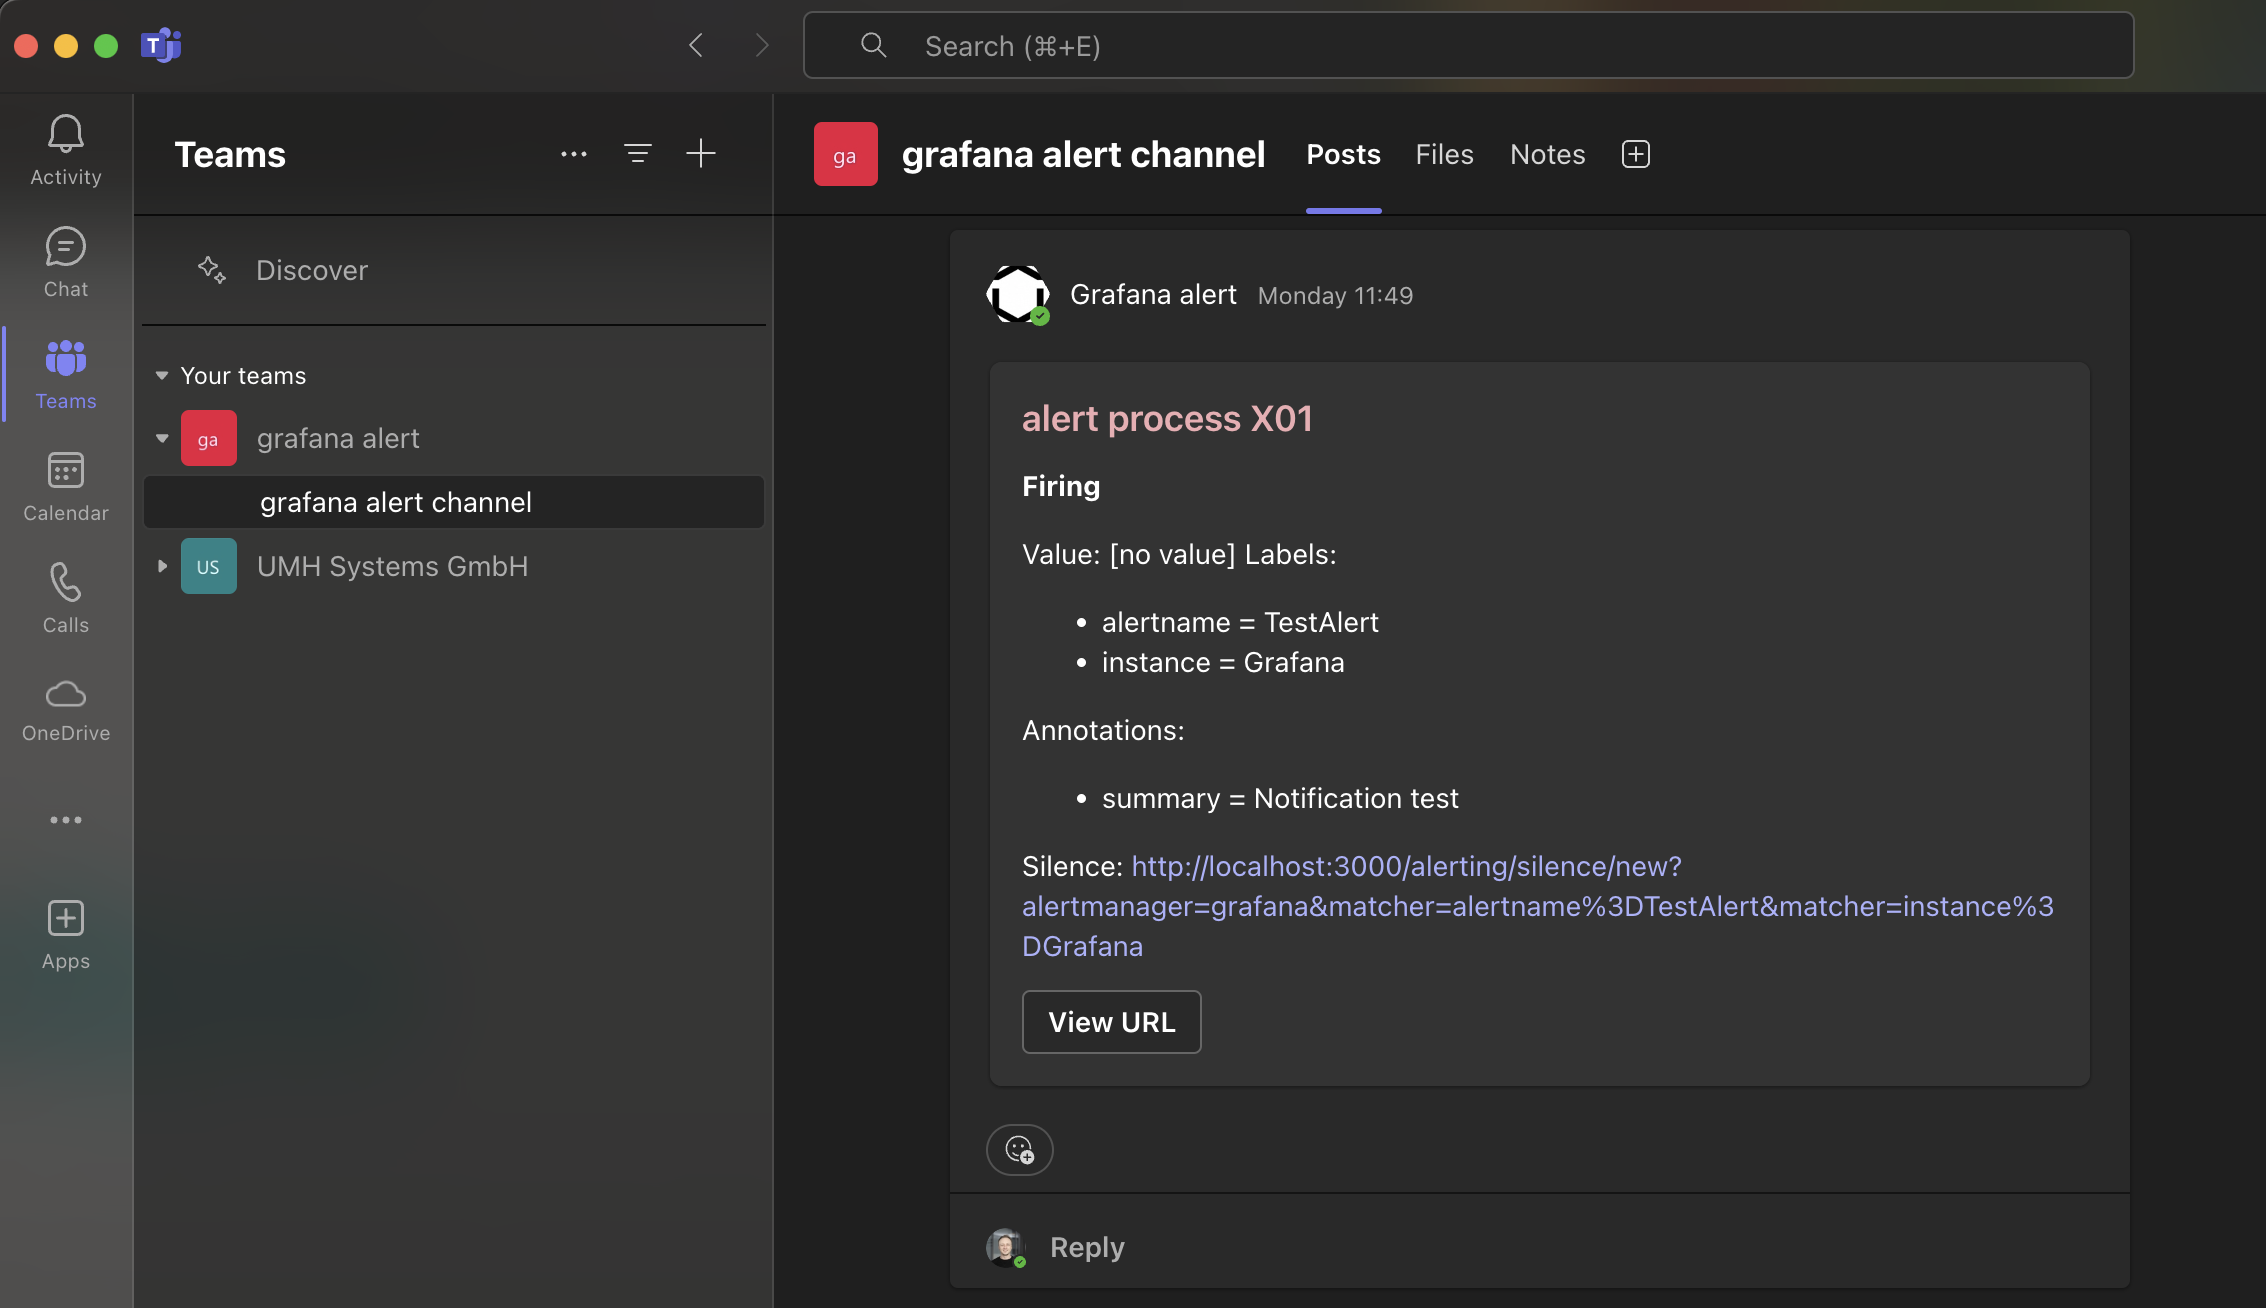
Add annotations and alert messages with simple descriptions, dynamic references to labels (e.g. {{ $labels.severity }}; https://grafana.com/docs/grafana/latest/alerting/alerting-rules/templates/), values and URLs to e.g., SOPs or third party systems.
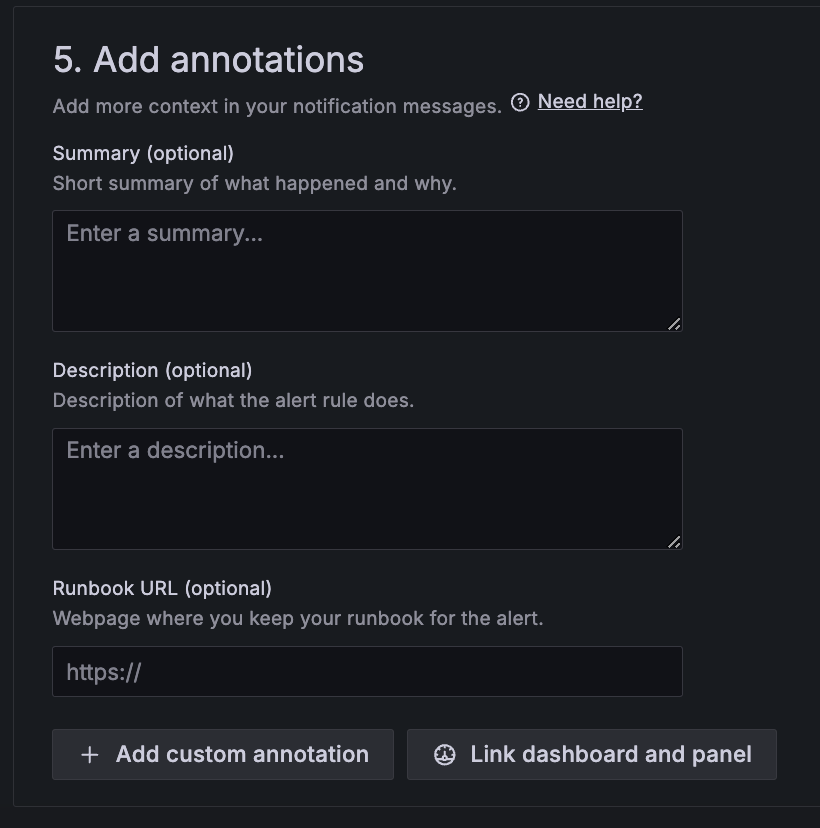
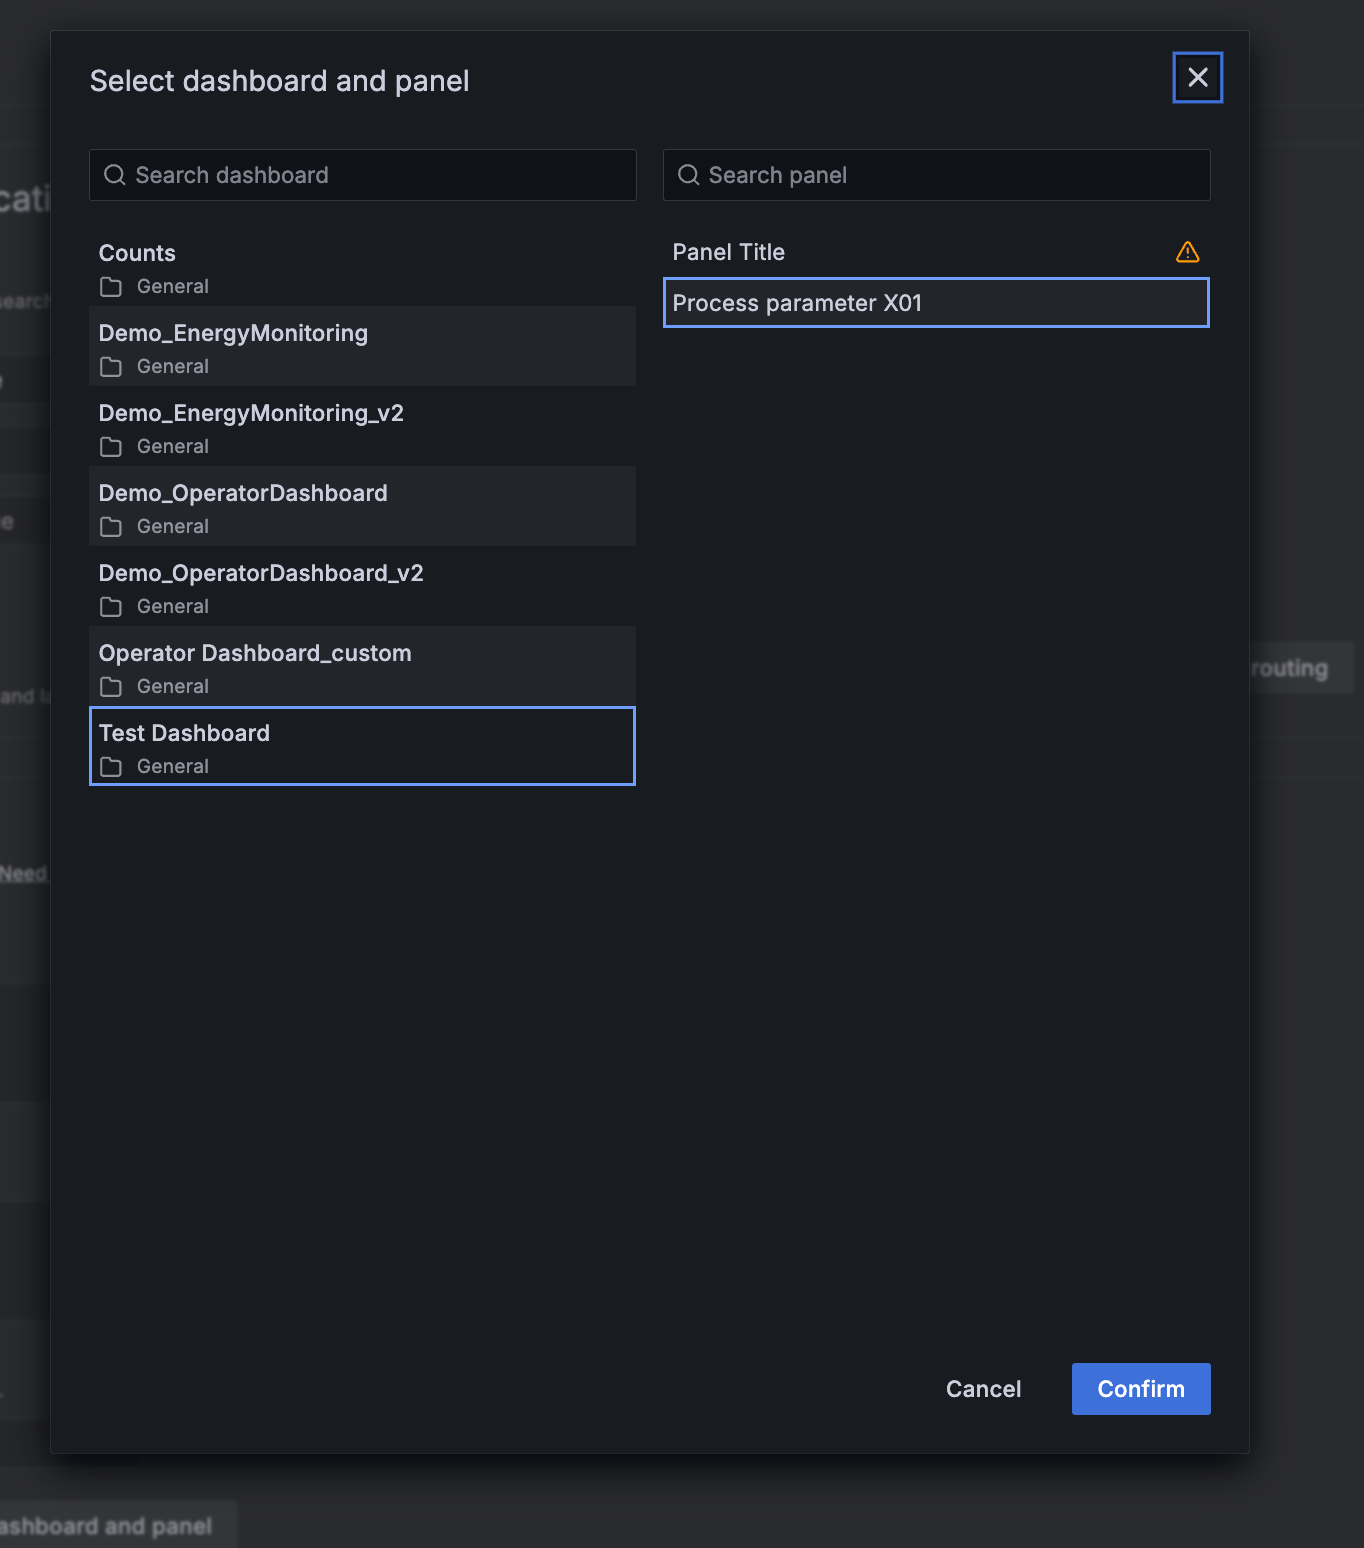
Link the alerts to dashboards and panels, to quickly access monitored data and reduce root cause finding time. The alert timings are then visualized in the linked dashboards.
Contact points
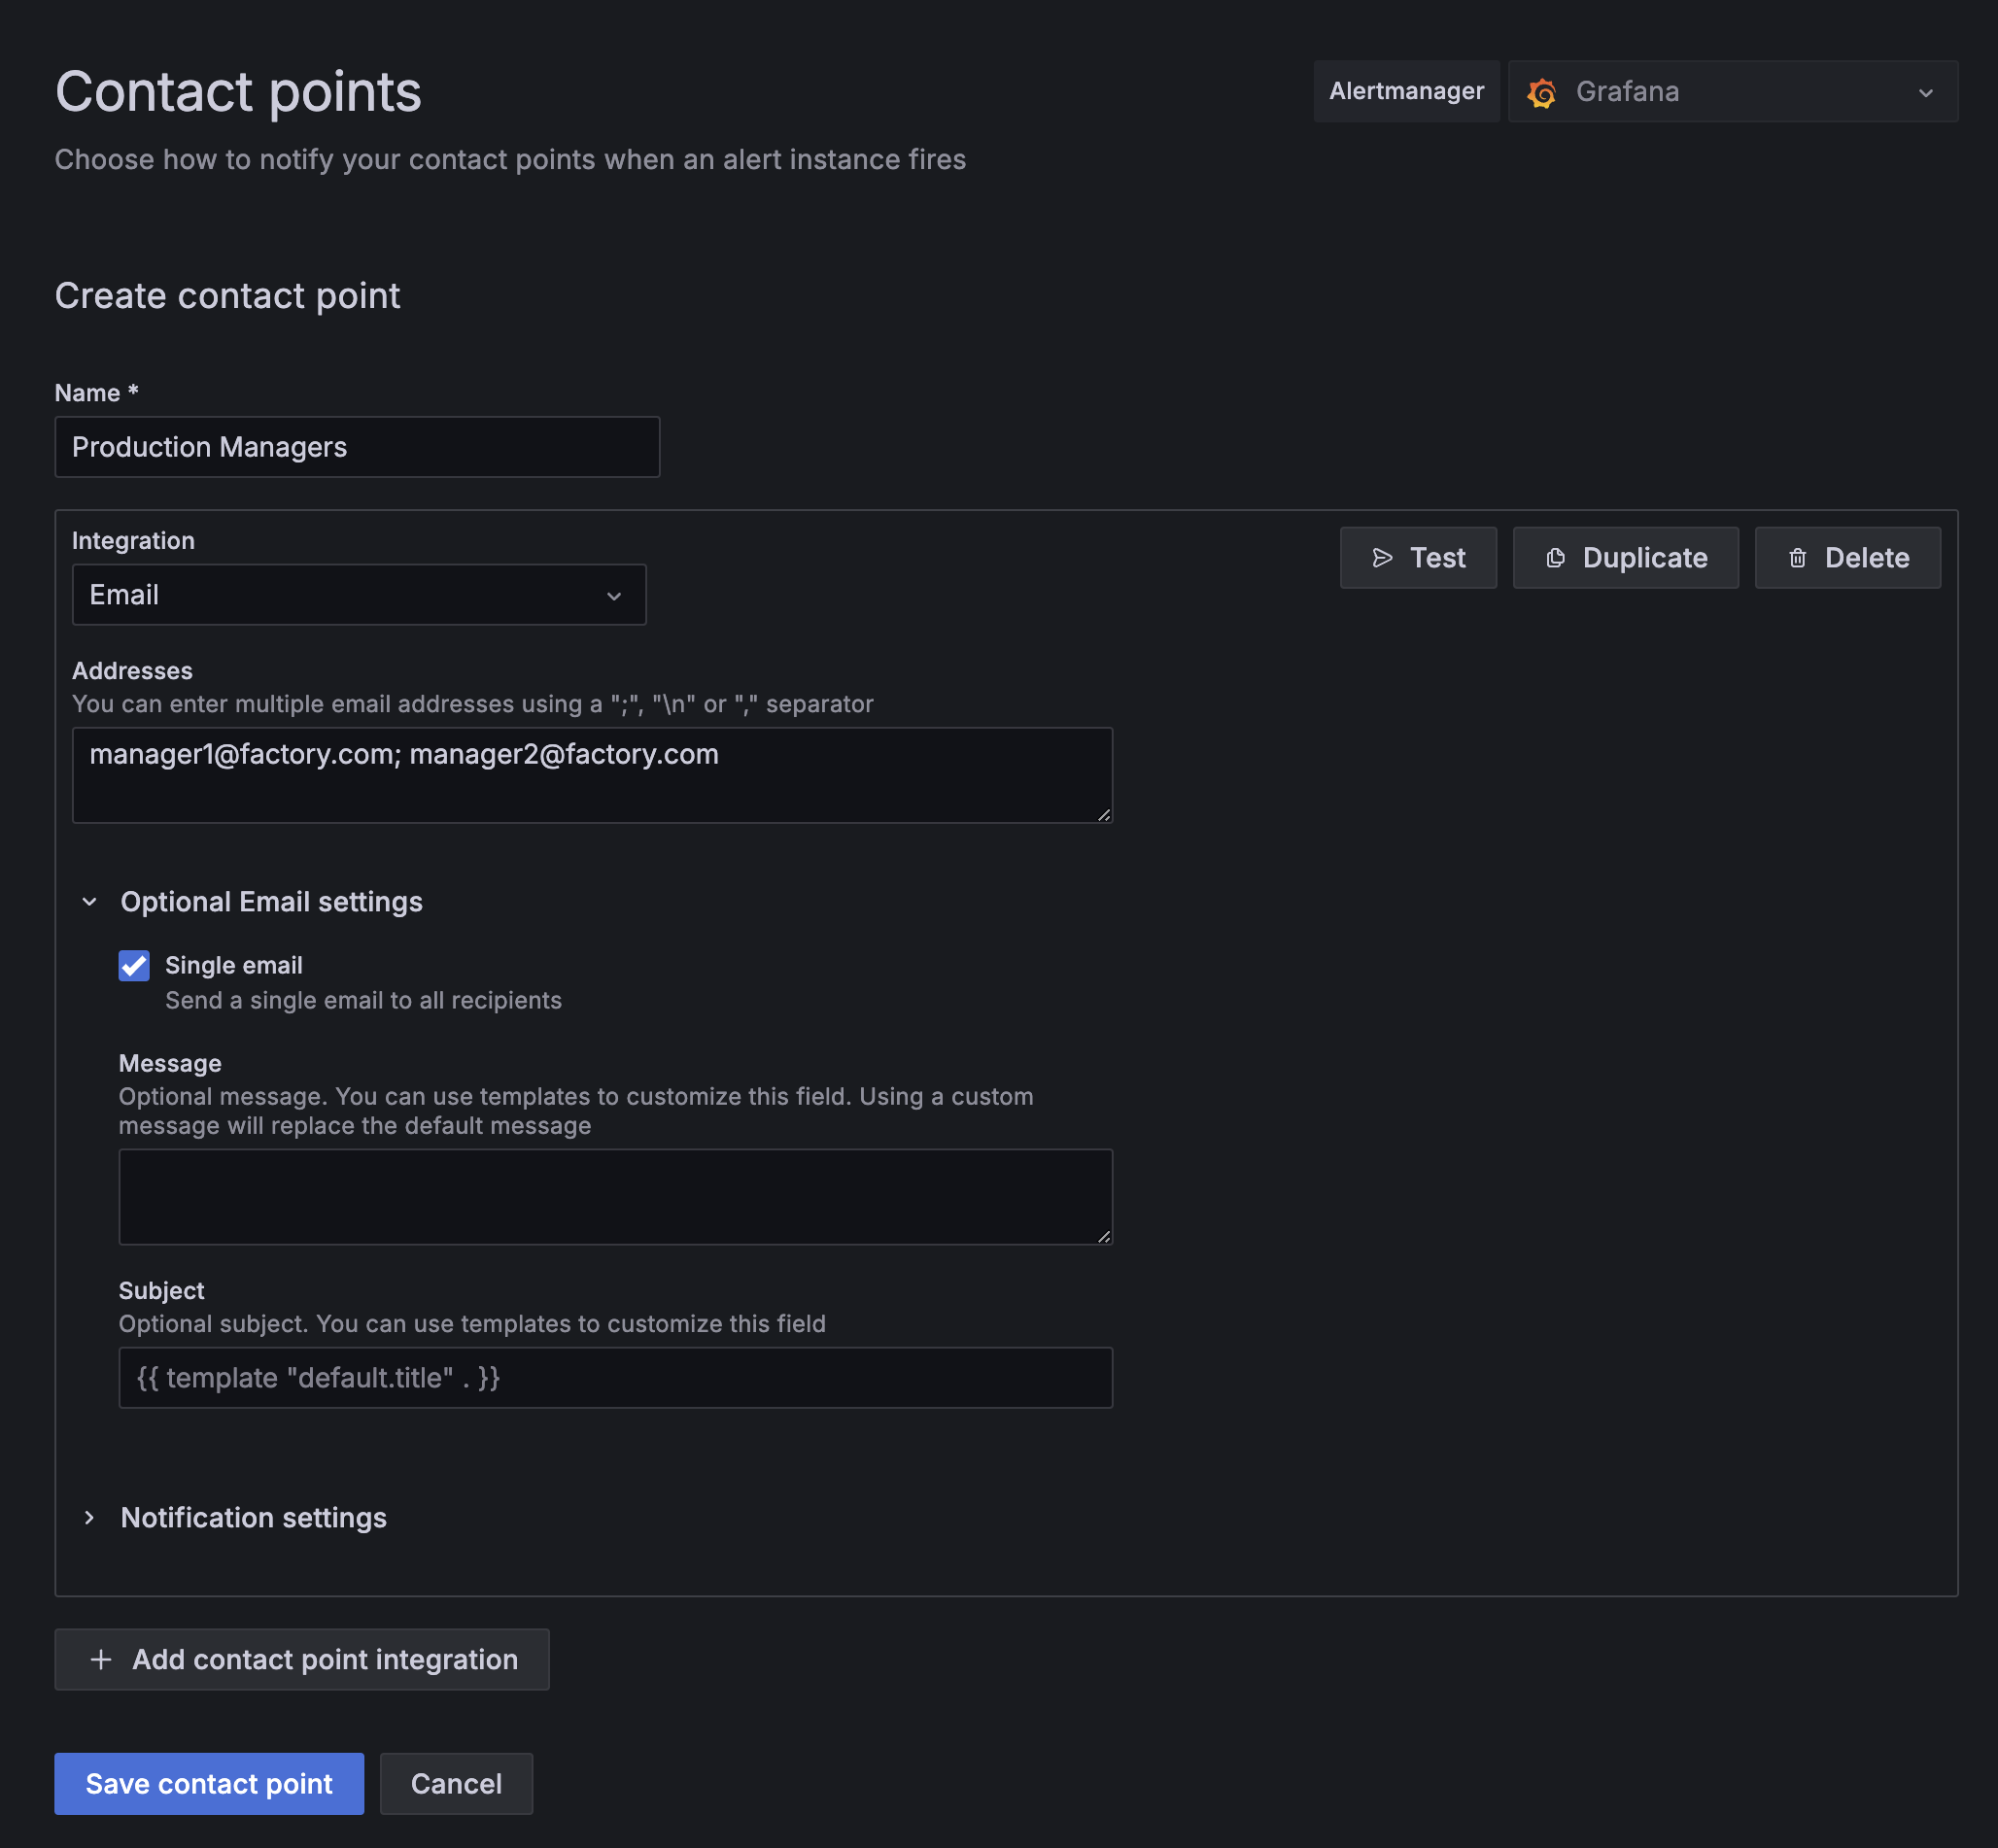
Under Alerting → Contact Points, you can create or edit the channels where notifications should be sent. Grafana supports email, MS Teams, Slack, webhooks, etc.
- You can specify multiple addresses as recipients.
- Under “Optional Email Settings,” “Single Email” is recommended so that replying to an alert automatically includes all stakeholders.
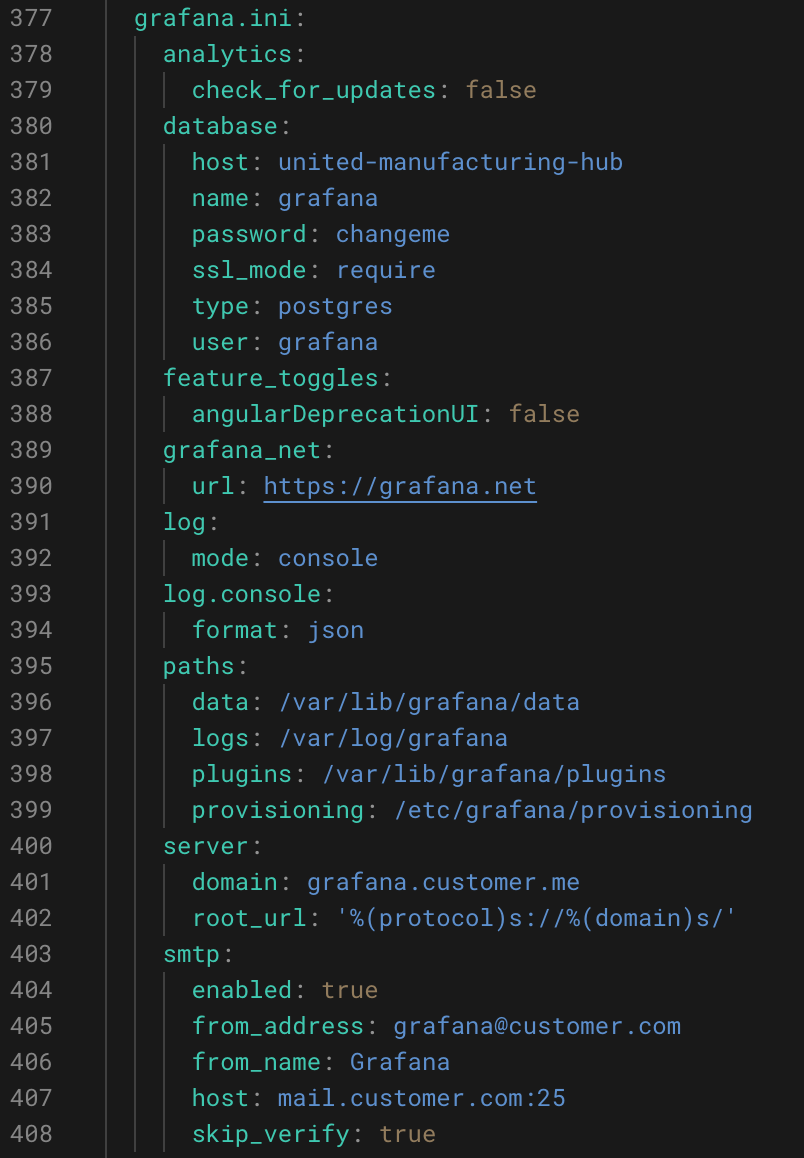
To enable Grafana to send emails an SMTP server credentials are required. These details can be added into grafana.ini configuration file. Best way is to update the HELM chart in the value.yaml (https://umh.docs.umh.app/docs/reference/helm-chart/#dz-grafana). This can be done with OpenLens under “Releases”. After upgrading and restarting the container testing the notification over the “Test” button will work. (soon to be integrated in the Management Console)
Microsoft Teams
Create a dedicated Teams channel, e.g., “Maintenance_Alerts.”
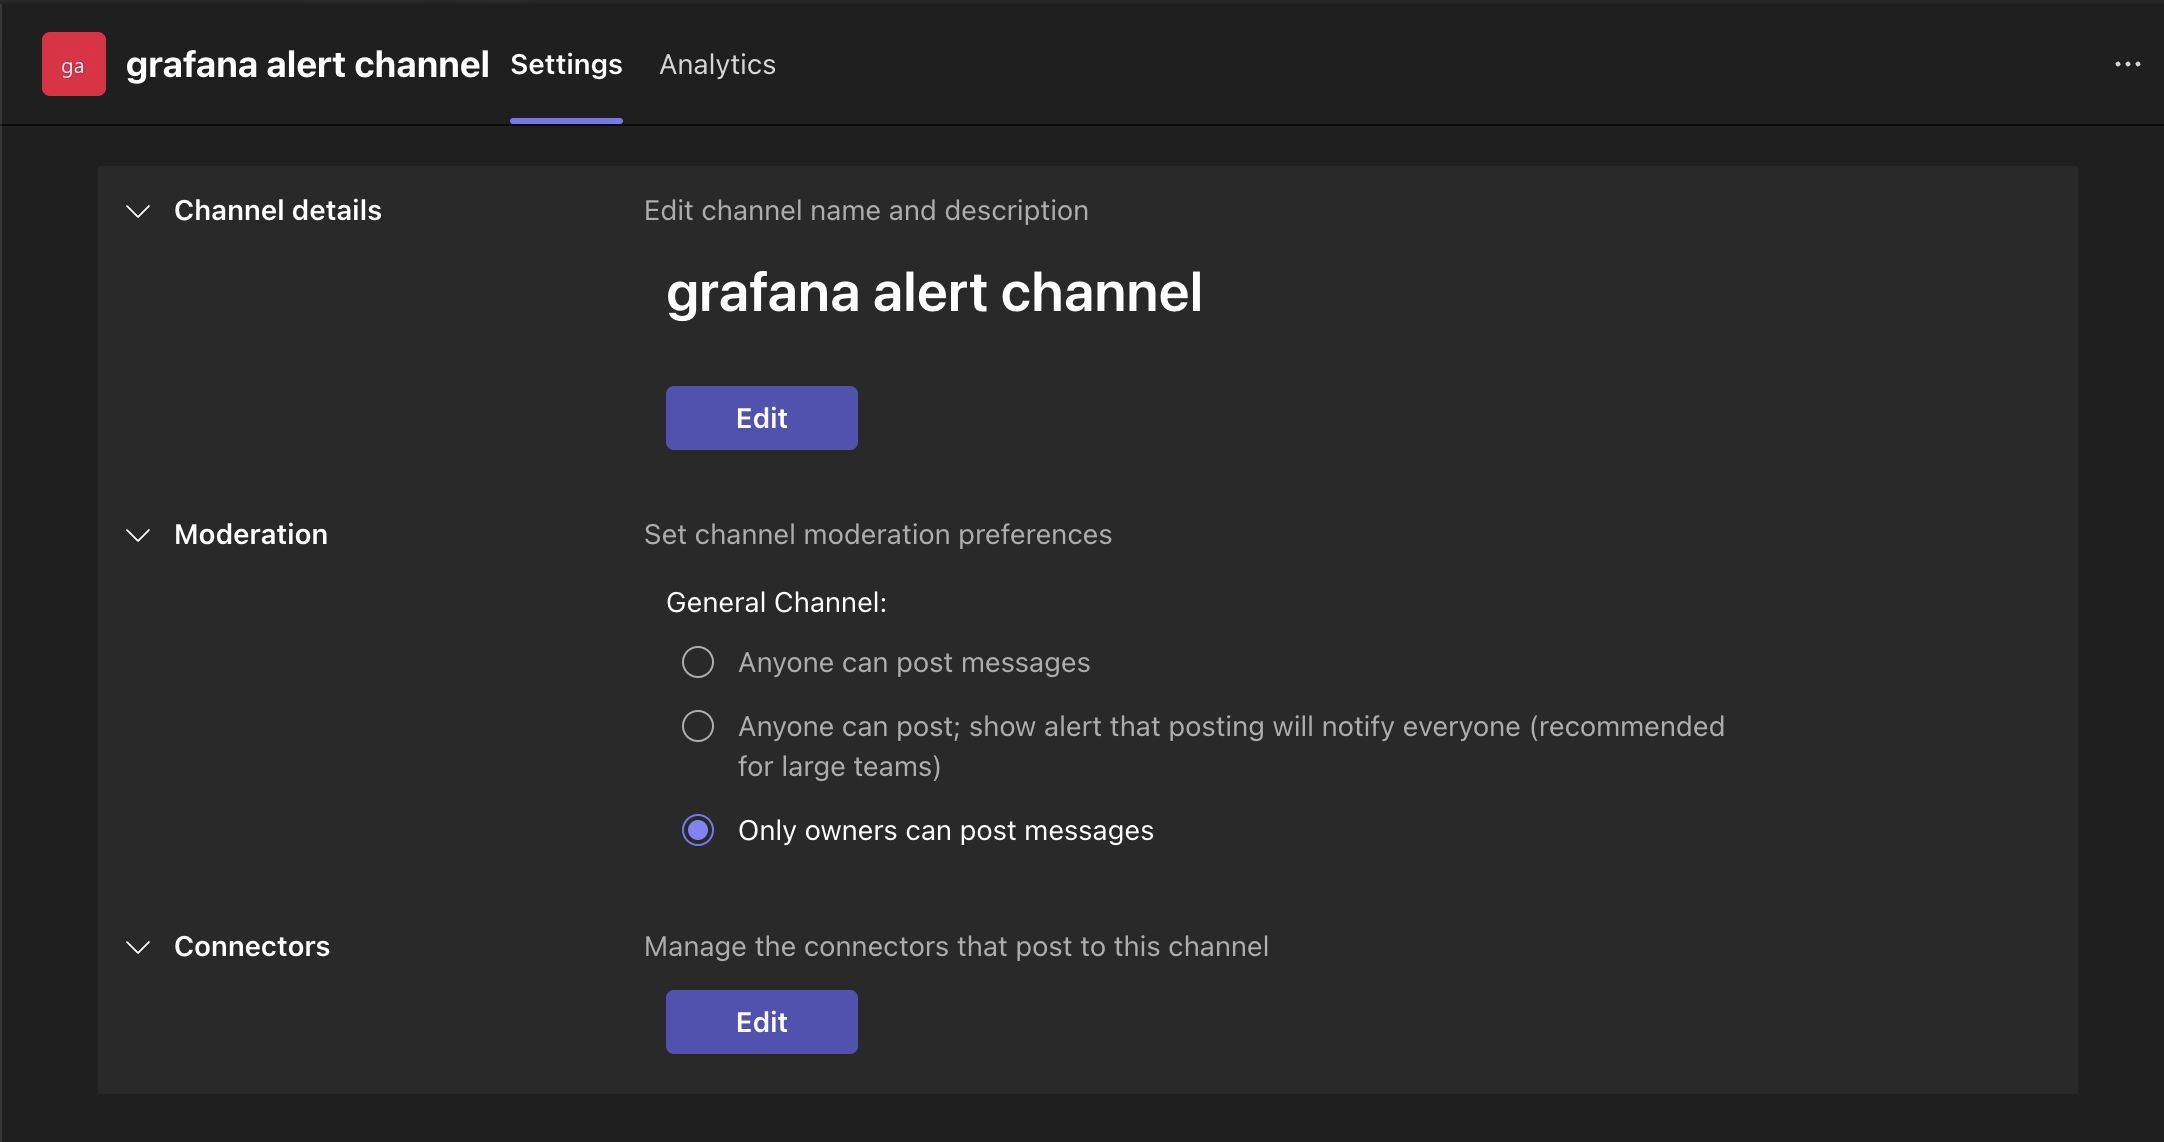
Within the channel settings → Connectors, set up an Incoming Webhook and copy its URL.
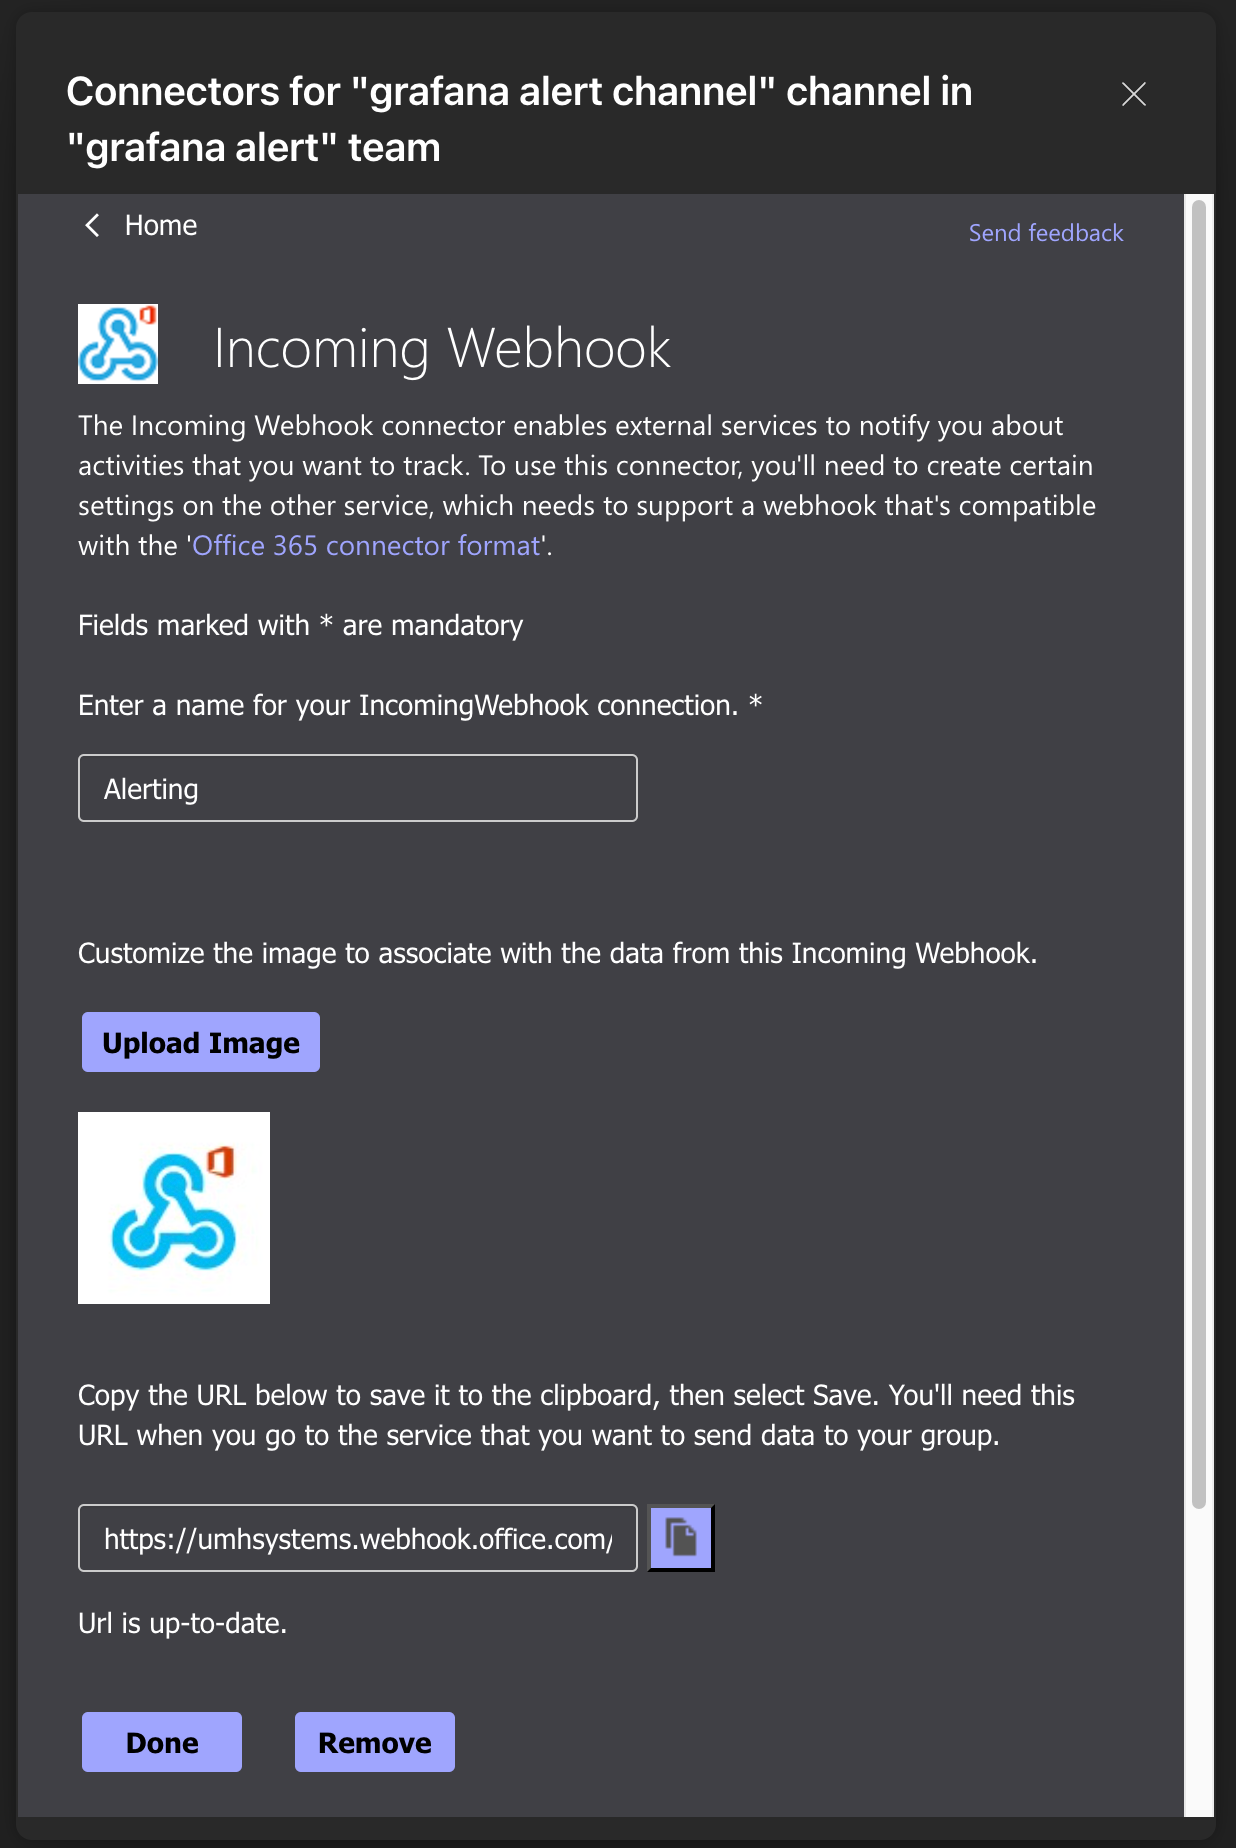
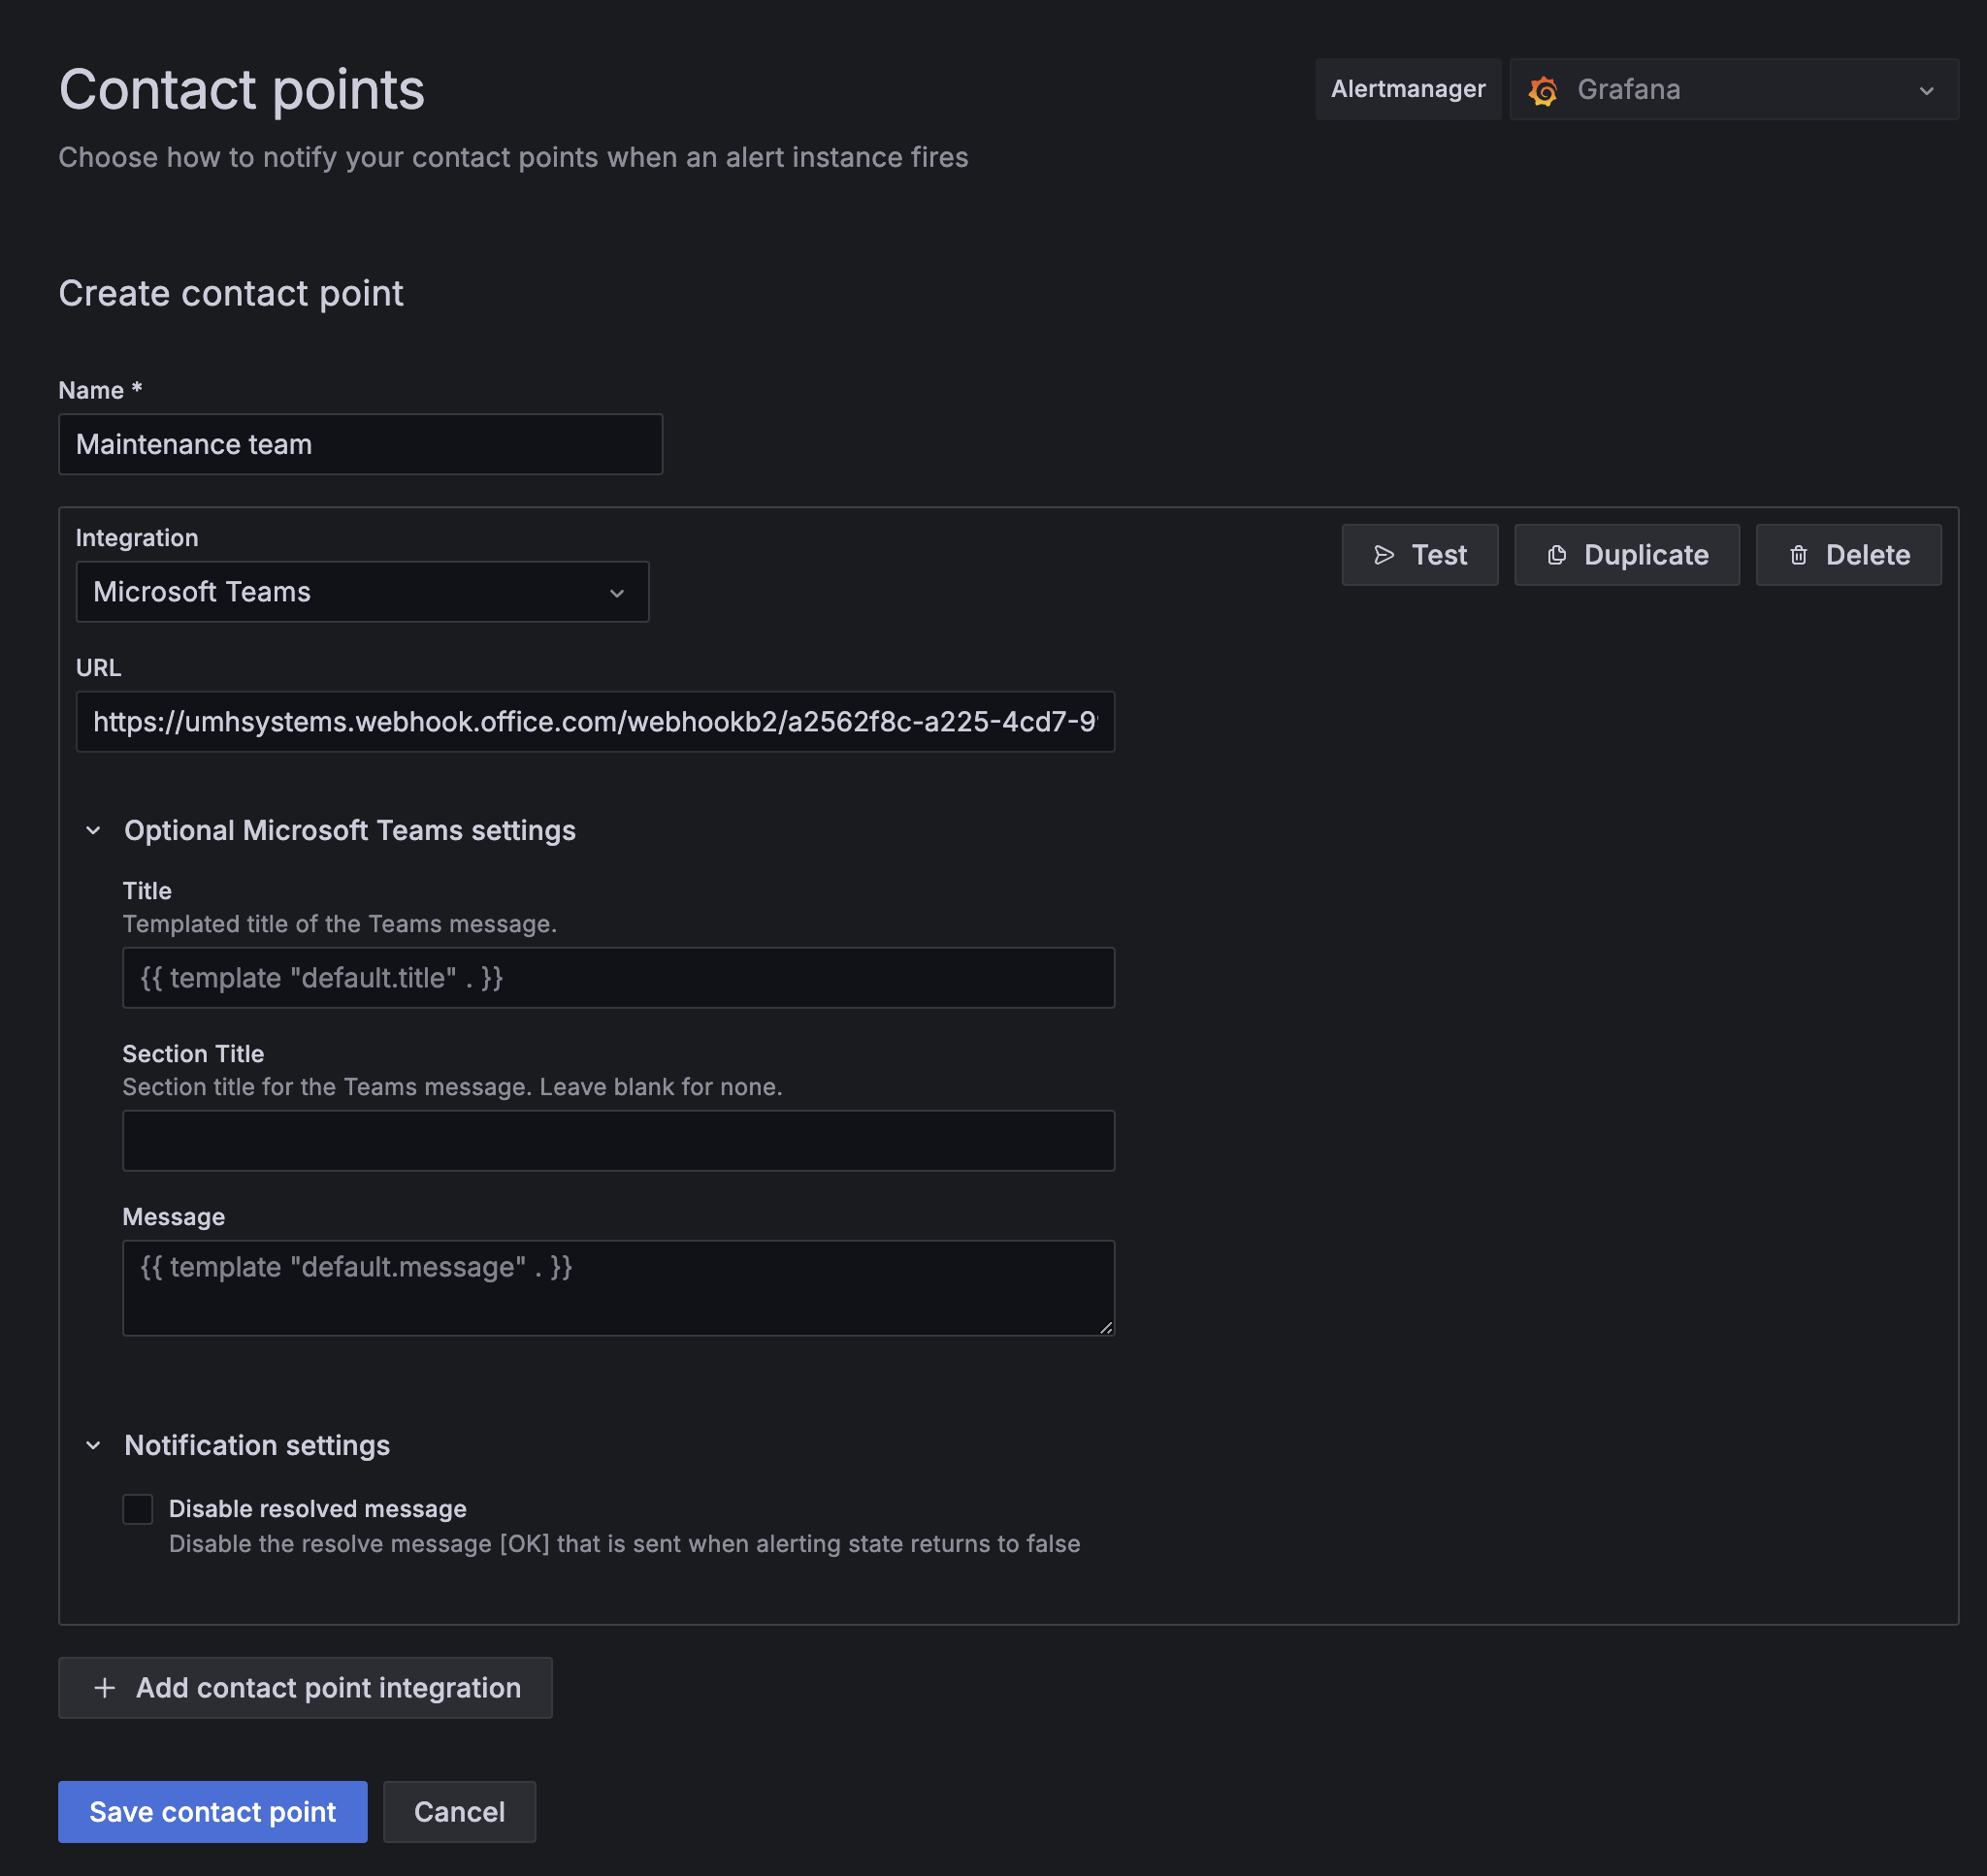
In Grafana, create a new contact point, choose “Microsoft Teams” as the Integration, and paste the webhook URL. Done.
Notification policies
Notification policies define how alerts are routed and delivered based on labels. This means the policies subcribes contact points to specific combinations of labels and values. This way notifications for new alerts are automatically forwarded to the correct contact points as long as the labels are matching.
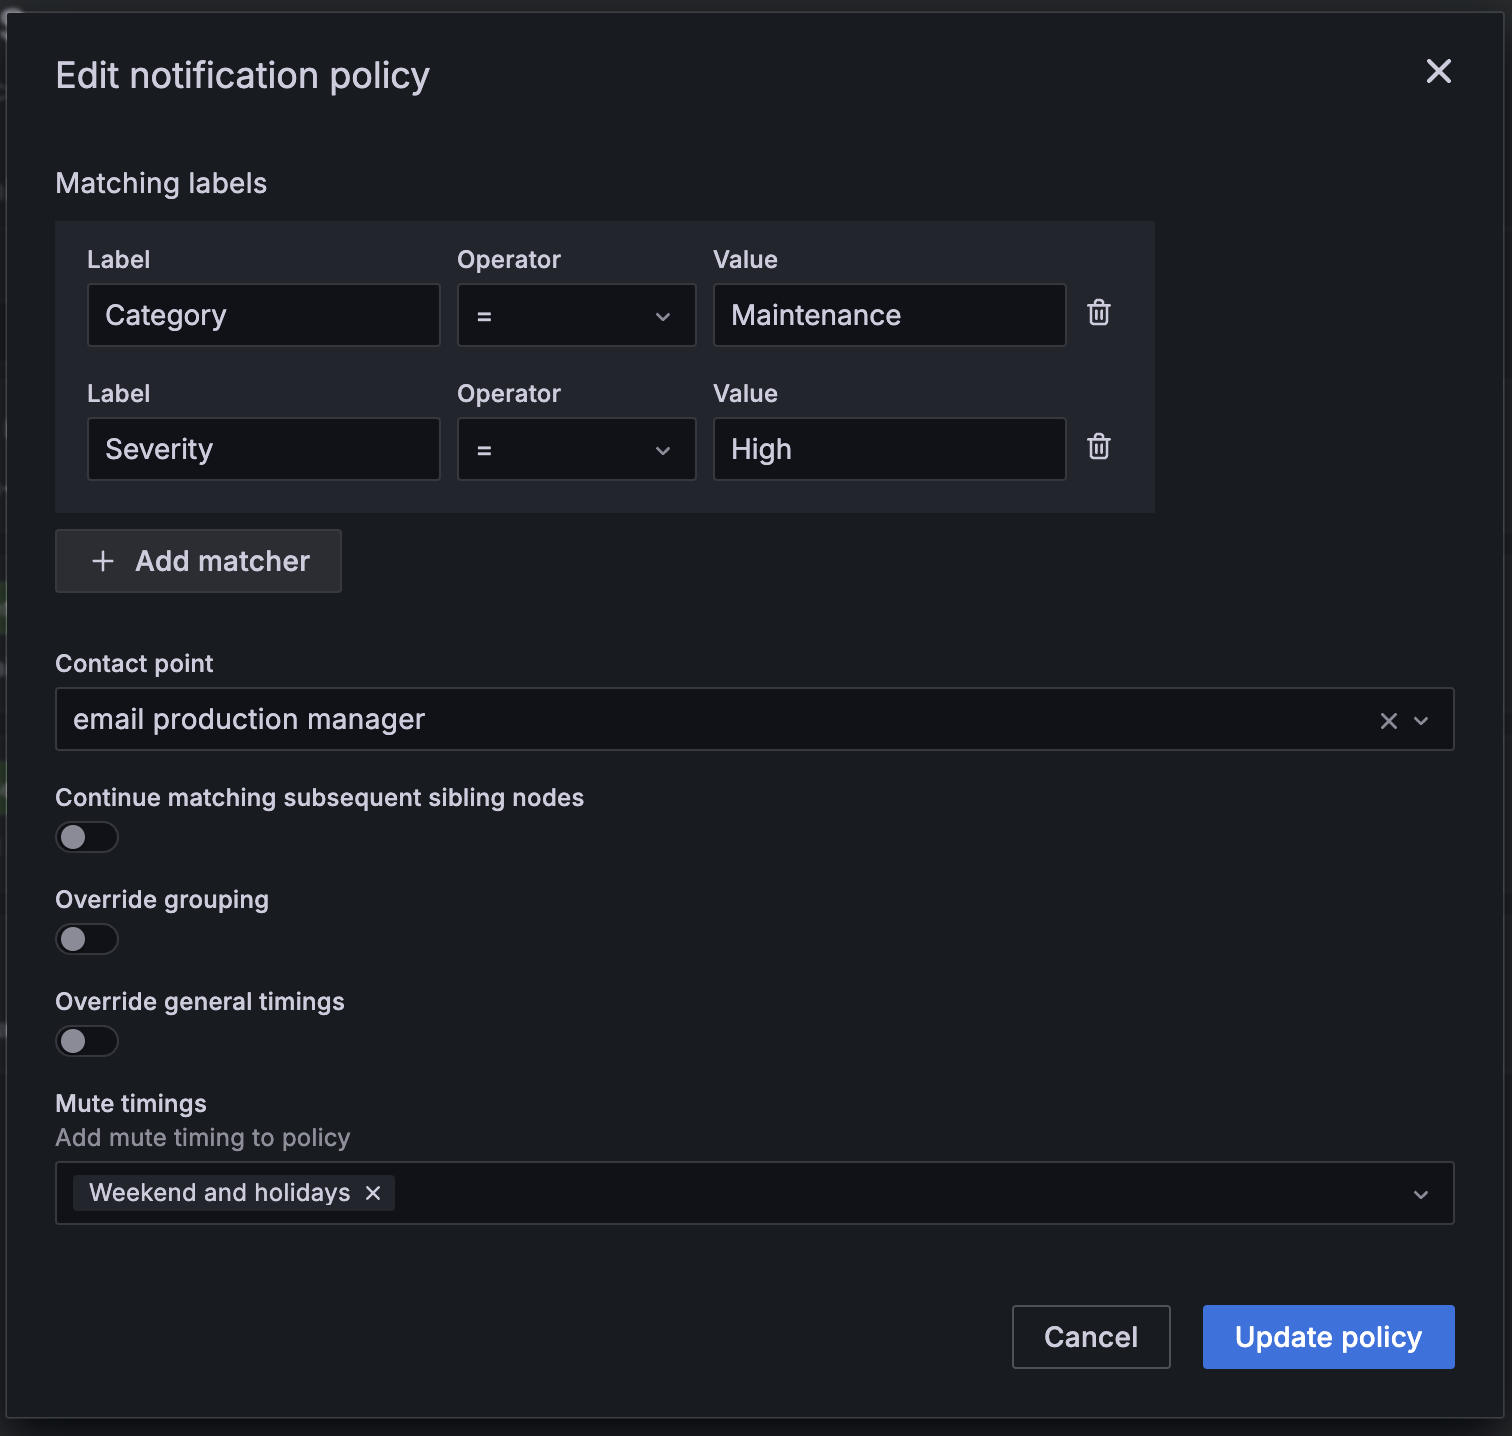
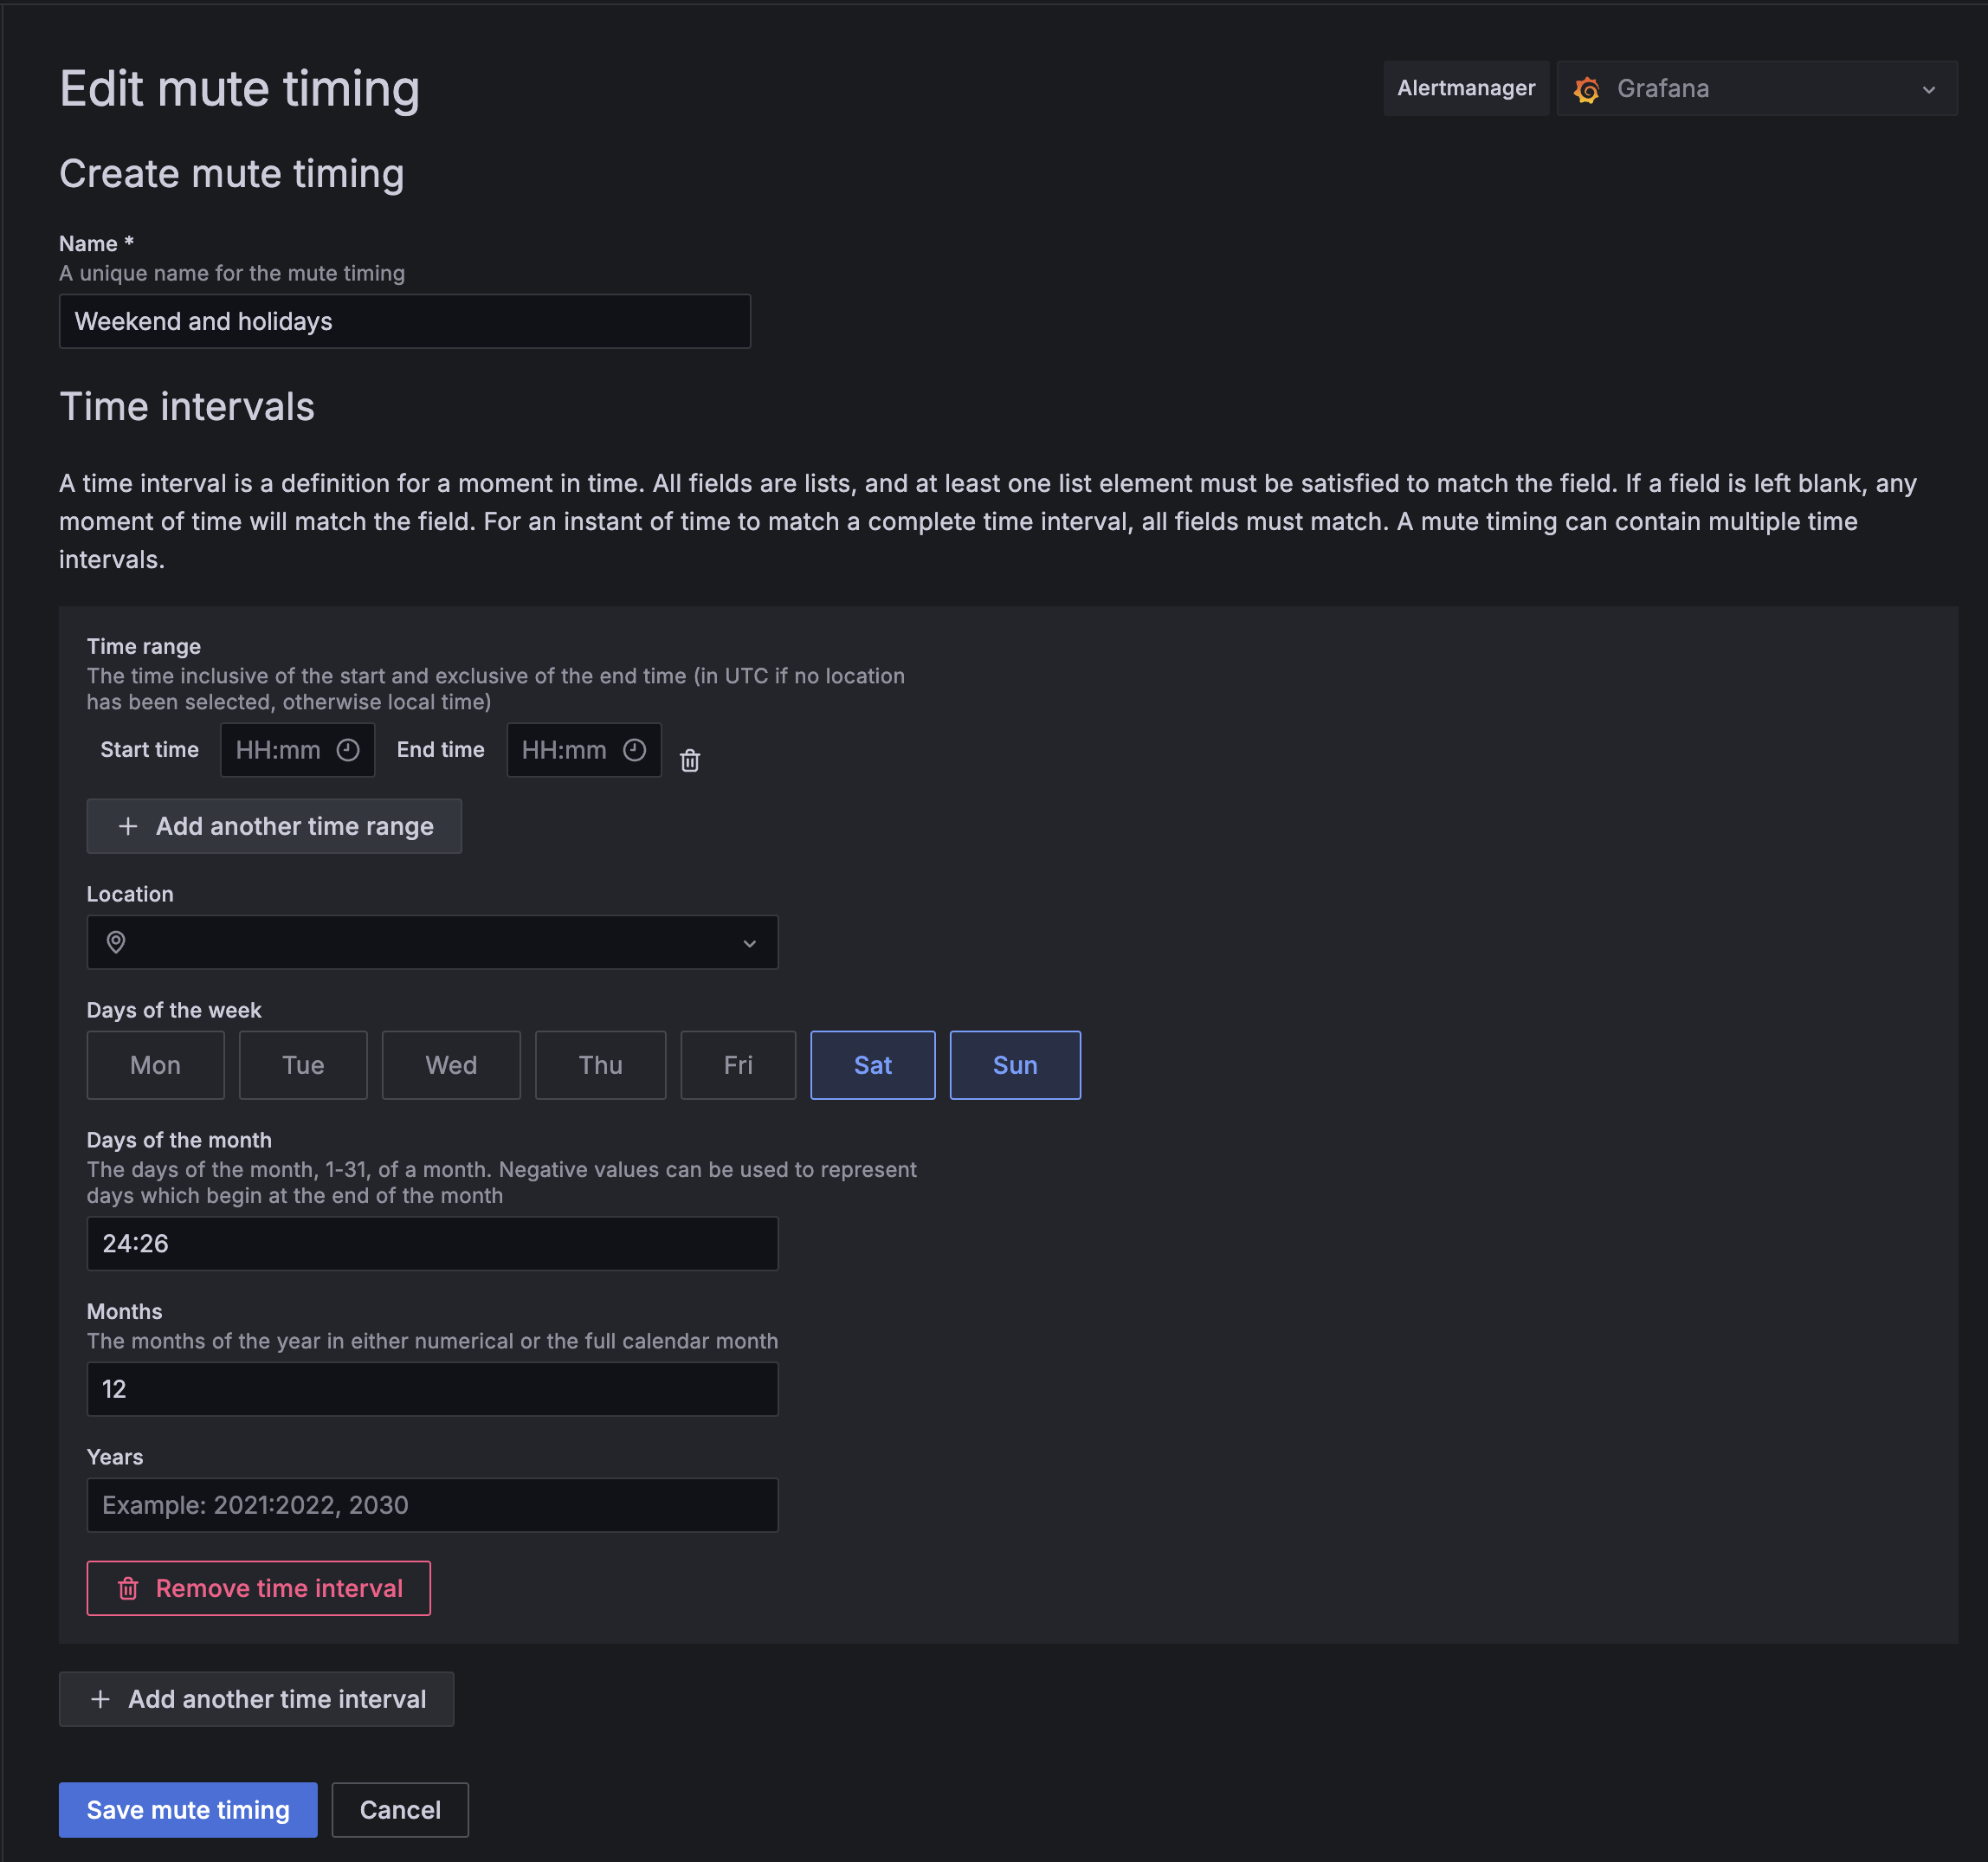
The mute timings need to be set up separately and are meant to define timeframes where notifications are turned off. E.g., on weekends and during holidays.
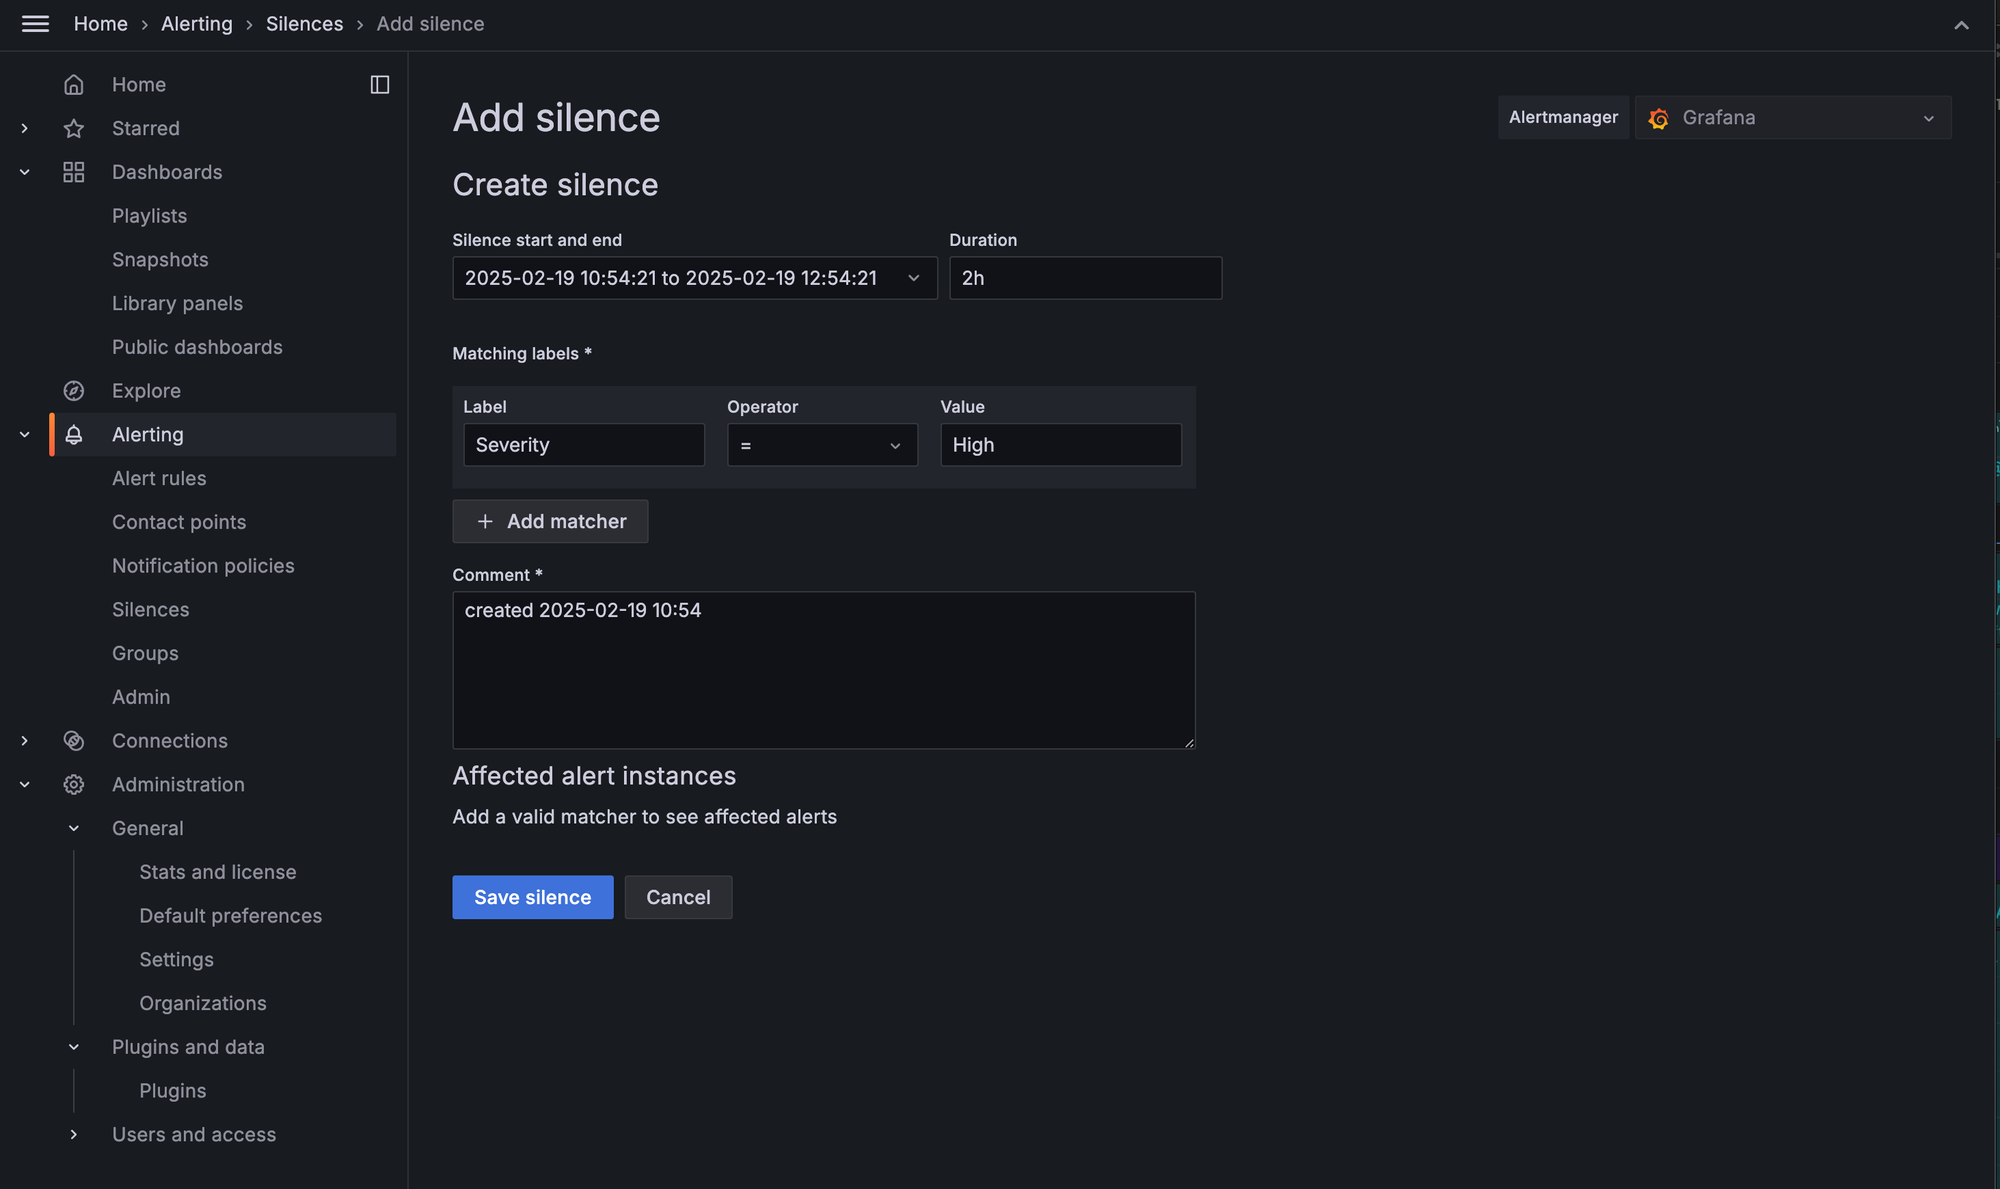
In case of recurring notifications spamming the communication channels a simple “Silence” for specific labels can be set up.
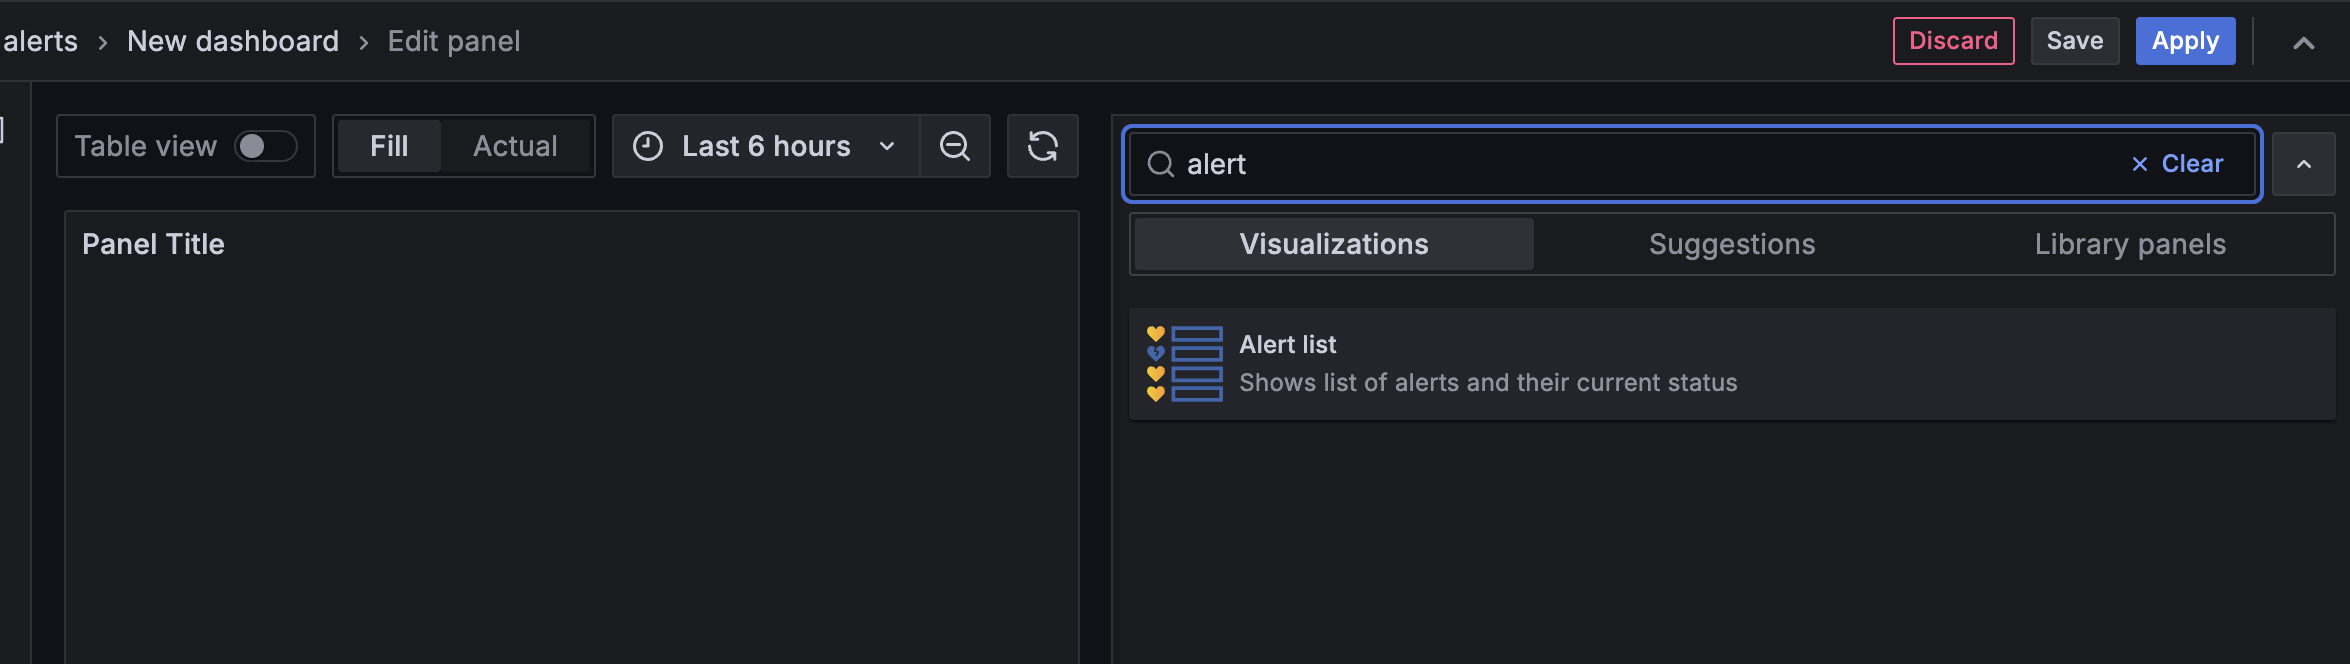
After setting up all alerts, visualize them and their current state in an alert list
- create a new panel in a dashboard and select “Alert list” from the widget drop down.
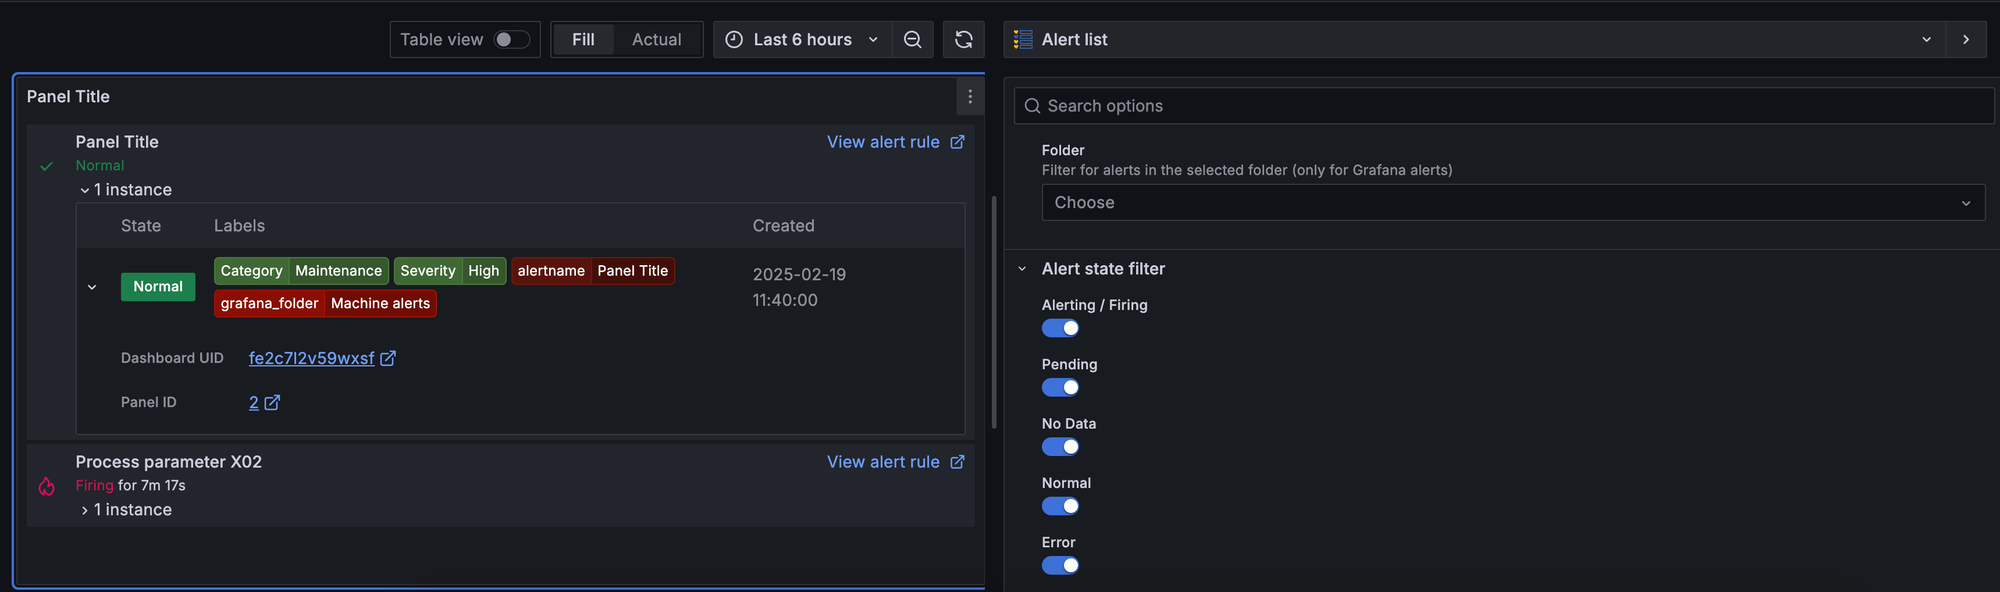
- configure the filters visualize only the relevant states
Summary
- Trigger Functions (queries & expressions) define when an alert fires.
- Contact Points set up the channels (email, Teams, etc.).
- Notification Policies determine who gets which alerts and when to mute or silence them.
You now have a powerful alerting system tailored to real industrial needs (workdays vs. weekends, maintenance teams, escalation tiers, etc.).
To learn more about other UMH features (Canvas visualizations, Node-RED integrations, etc.), check out this article or join our Discord


