


Are your factory dashboards falling short, providing only fragmented data and static visuals? Do you wish for an intuitive overview of your production floor that resembles the familiar layout of your SCADA systems? We previously explored using Grafana Canvas for shop floor visualizations, but as Grafana has evolved, so have the possibilities. Our earlier article offered a foundational understanding, but it lacked detailed customization options, integration of real-time data using SQL queries, and advanced logic implementations crucial for modern operations. In this updated guide, we'll dive deeper into:
- Hosting custom SVG files persistently using Node-RED and Kubernetes volumes.
- Leveraging Grafana Canvas to create dashboards that mirror your production floor layout.
- Implementing production line logic to display real-time machine states, even for machines not directly connected.
By the end of this tutorial, you'll transform Grafana into a powerful tool tailored for Operational Technology (OT), offering a comprehensive, real-time view of your factory floor that accelerates decision-making and enhances operational efficiency.
Prerequisites
To follow along, ensure you have the following:
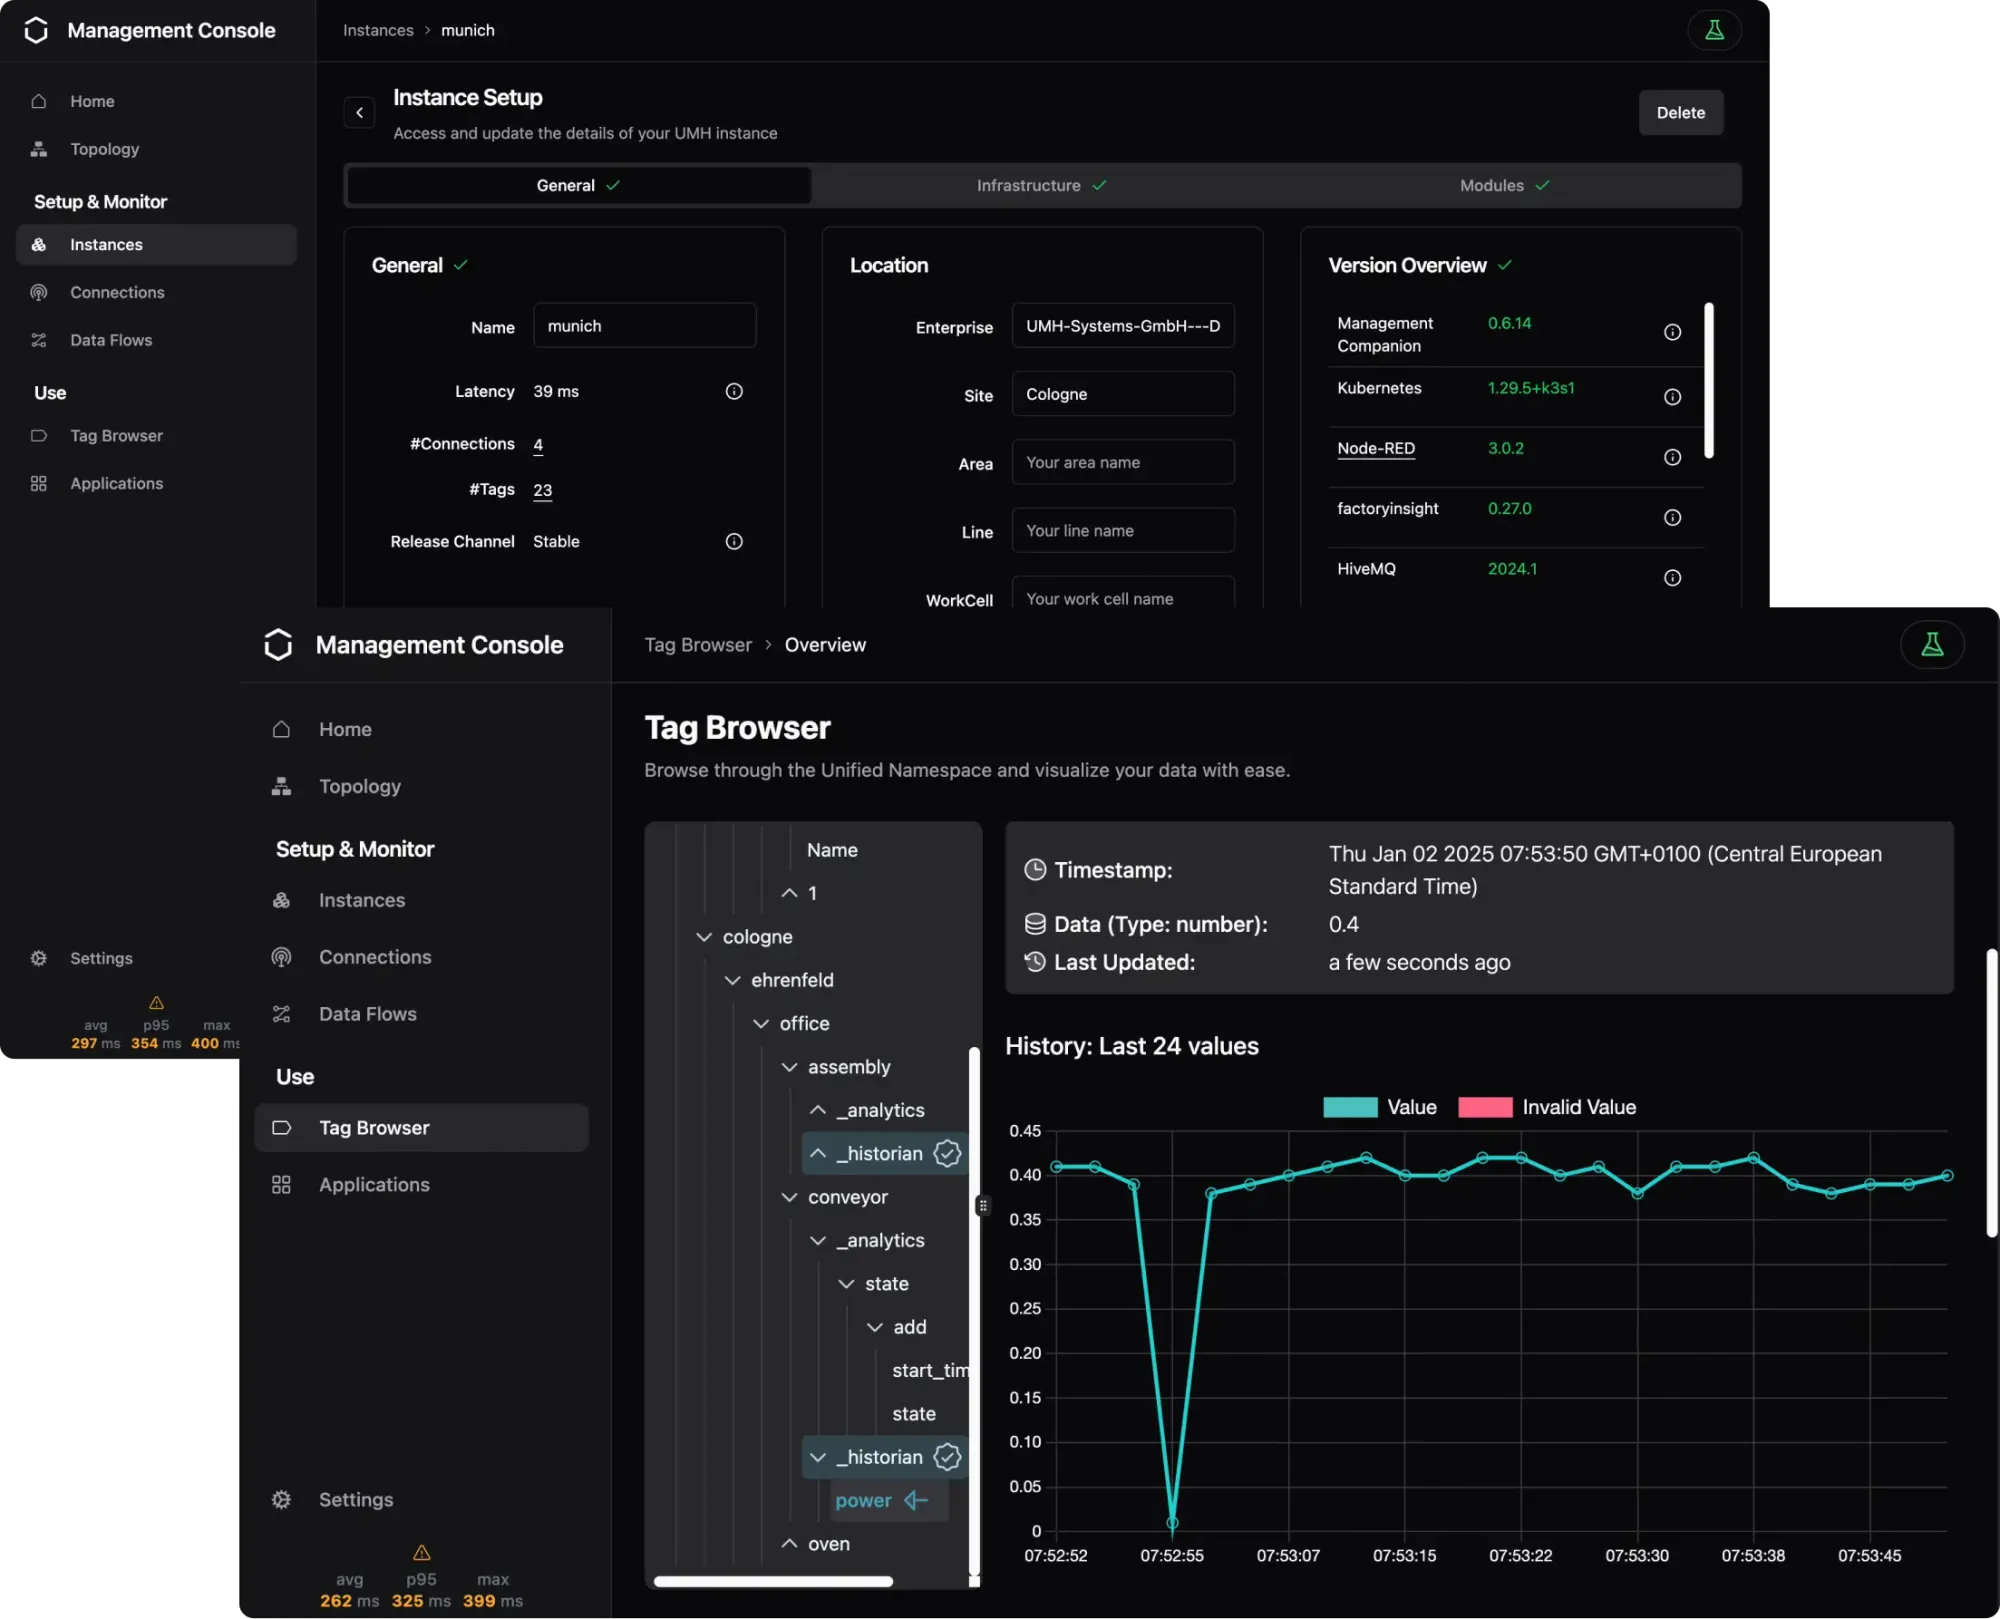
- A running instance of United Manufacturing Hub (UMH)
- Grafana Canvas plugin (Preinstalled with Grafana version 9.3 or newer)
- OpenLens connected with your Kubernetes cluster
- An SVG file representing your shop floor layout (e.g.,
example.svg)- Note: Grafana Canvas does not support uploading images directly.
- Access to your cluster via SSH
Setting up the work environment
Challenges and Solution Approach
Grafana Canvas doesn't support direct image uploads. Modifying the Grafana deployment to include custom images isn't sustainable since changes can be overwritten during UMH or Helm chart upgrades. We need a solution that persists across upgrades and restarts.
We'll use Node-RED, which comes pre-installed with UMH, to host the SVG files. Node-RED stores its data in a Persistent Volume Claim (PVC) mounted at /data. This means any files stored in /data will persist even after pod restarts or UMH upgrades.
Step 1: Hosting SVG Files with Node-RED
1. Access Node-RED
- Open Node-RED by navigating to
http://<your-cluster-ip>:1880.
2. Create a New Flow
Click the "Plus" icon to create a new flow.

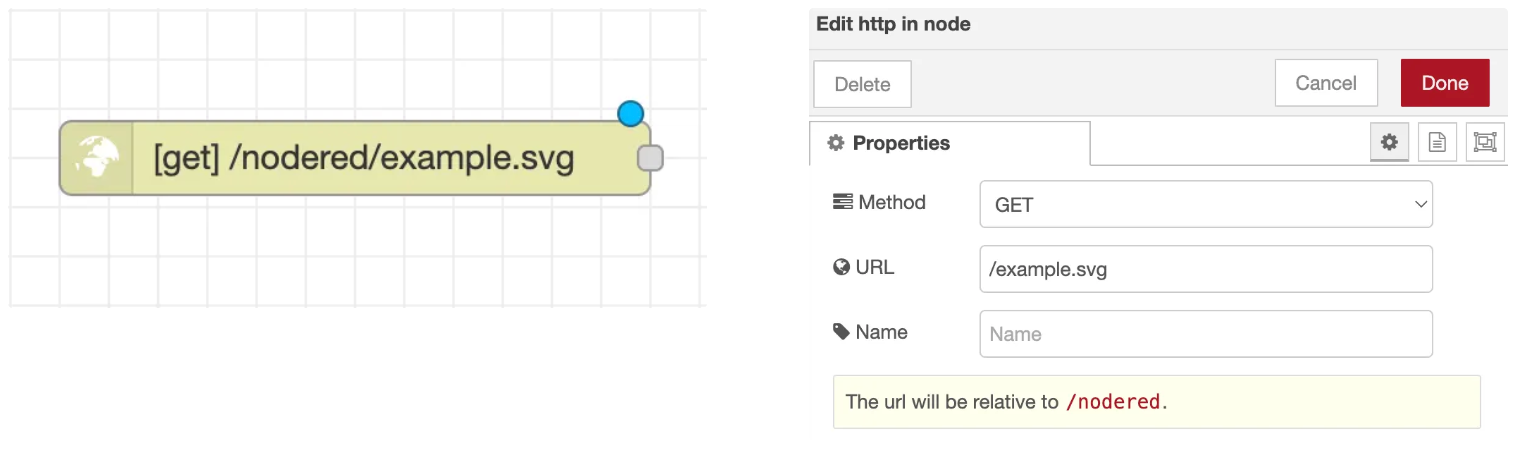
3. Set Up an HTTP Endpoint
- From the palette on the left, drag an "http in" node to the workspace.
- Double-click the node to configure it:
- Method: GET
- URL:
/example.svg - Click "Done".
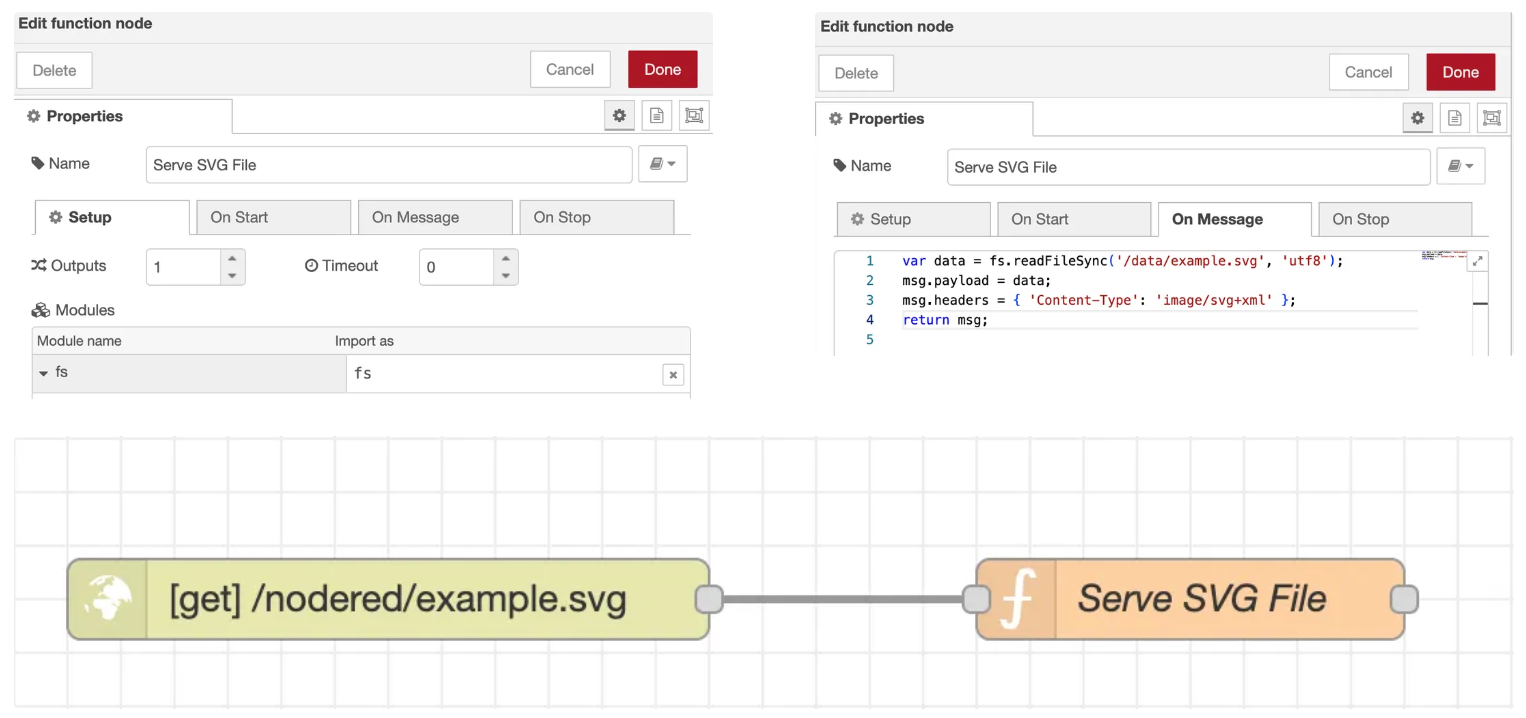
4. Add a Function Node to Serve the SVG File
- Drag a "function" node into the workspace.
- Connect it to the "http in" node.
- Double-click the function node to edit:
- Name: Serve SVG File
- Modules: The
fsmodule comes preinstalled with Node-RED as part of Node.js - Function Code On Message:
var data = fs.readFileSync('/data/example.svg', 'utf8');
msg.payload = data;
msg.headers = { 'Content-Type': 'image/svg+xml' };
return msg;
- Click "Done".
5. Set Up an HTTP Response Node
- Drag an "http response" node into the workspace.
- Connect it to the "function" node.
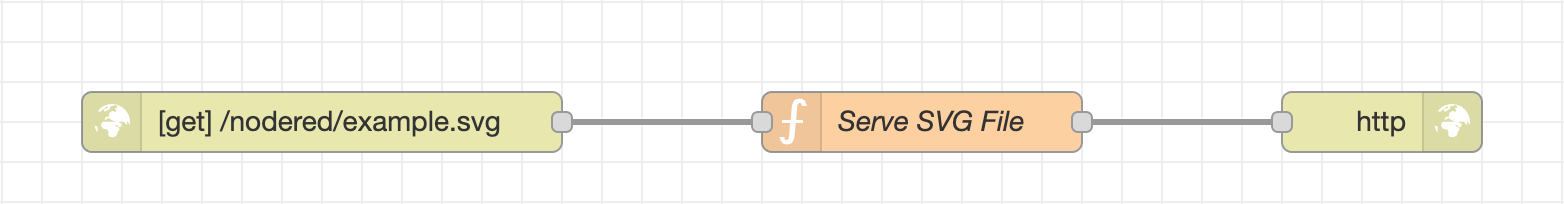
6. Deploy the Flow
- Click "Deploy" to activate the flow.
7. Copy the SVG File to Node-RED's Data Directory
- Copy file to your cluster
scp <path/to/example.svg> <user_name>@<ip_of_the_cluster>:
- SSH into your cluster:
ssh <user_name>@<ip_of_the_cluster>
- Copy the
example.svgfile to Node-RED's data directory:Explanation: The/datadirectory in Node-RED is backed by a Persistent Volume Claim (PVC), as shown in the UMH Helm chart configuration. This means any files placed here will persist across pod restarts and upgrades.
kubectl cp <path/to/example.svg> united-manufacturing-hub-nodered-0:/data/example.svg -n united-manufacturing-hub --kubeconfig /etc/rancher/k3s/k3s.yaml
8. Validate the Endpoint
- Open a browser and navigate to
http://<your-cluster-ip>:1880/example.svg. - Your SVG image should be displayed.
Step 1.2: Configuring CORS (If Necessary)
If your Grafana dashboard later fails to load the SVG with a cross-origin error in the browser console, follow these steps to configure CORS.
1. Add an HTTP Response Header
- Between the "function" node and the "http response" node, add a "change" node.
- Configure it to set
msg.headers['Access-Control-Allow-Origin']to'*'. - This allows any origin to access the resource, resolving CORS issues.
2. Redeploy the Flow
- Click "Deploy".
Step 2: Creating the Dashboard
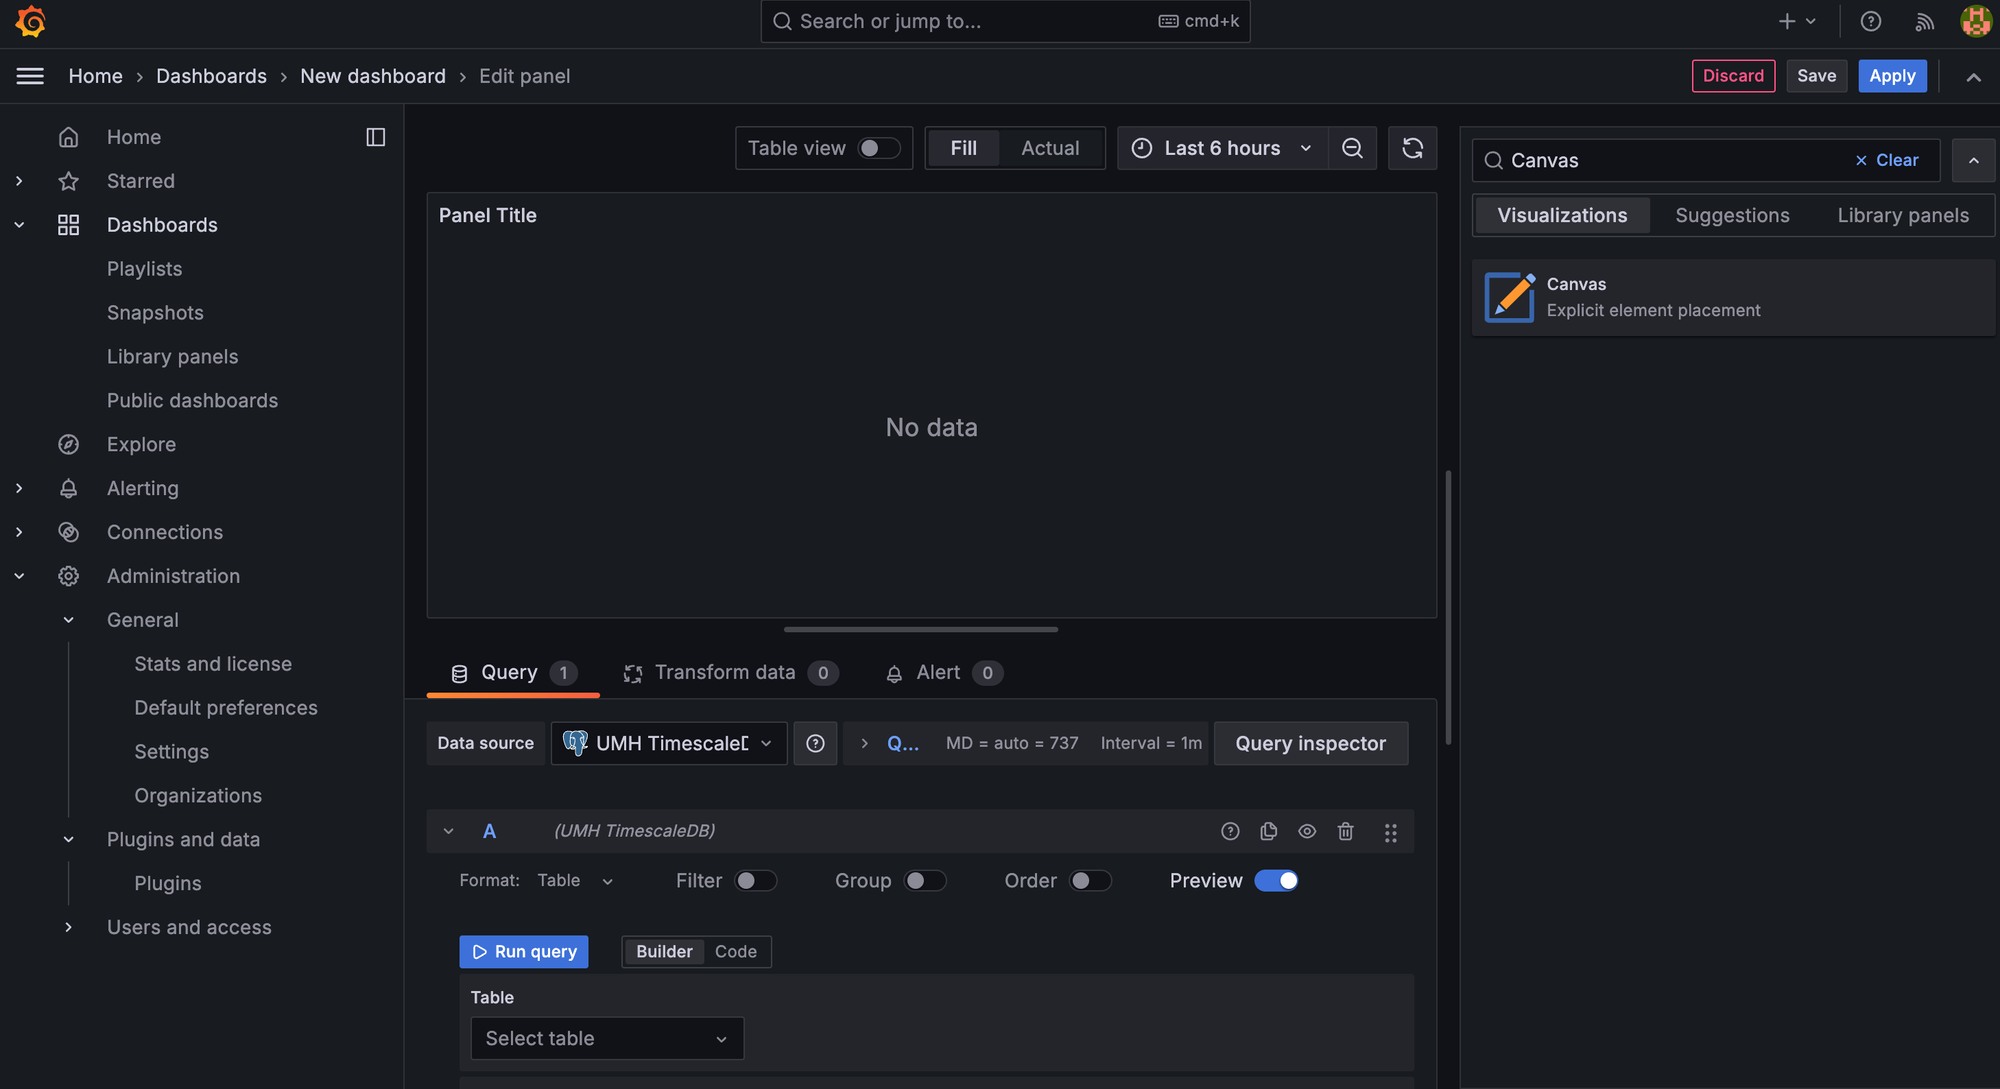
- Create a new dashboard and add a Canvas-type visualization to it.
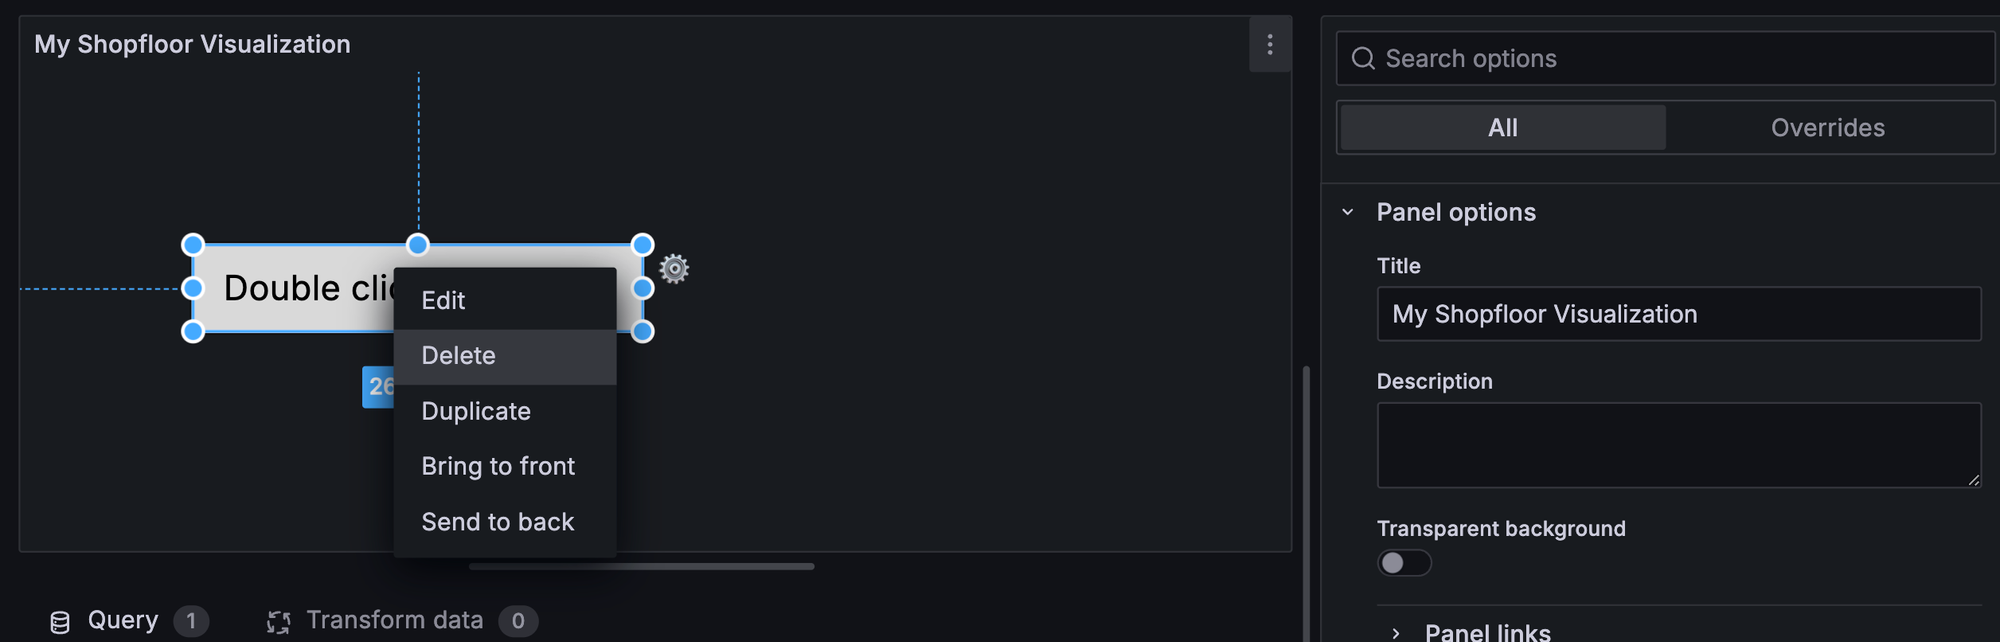
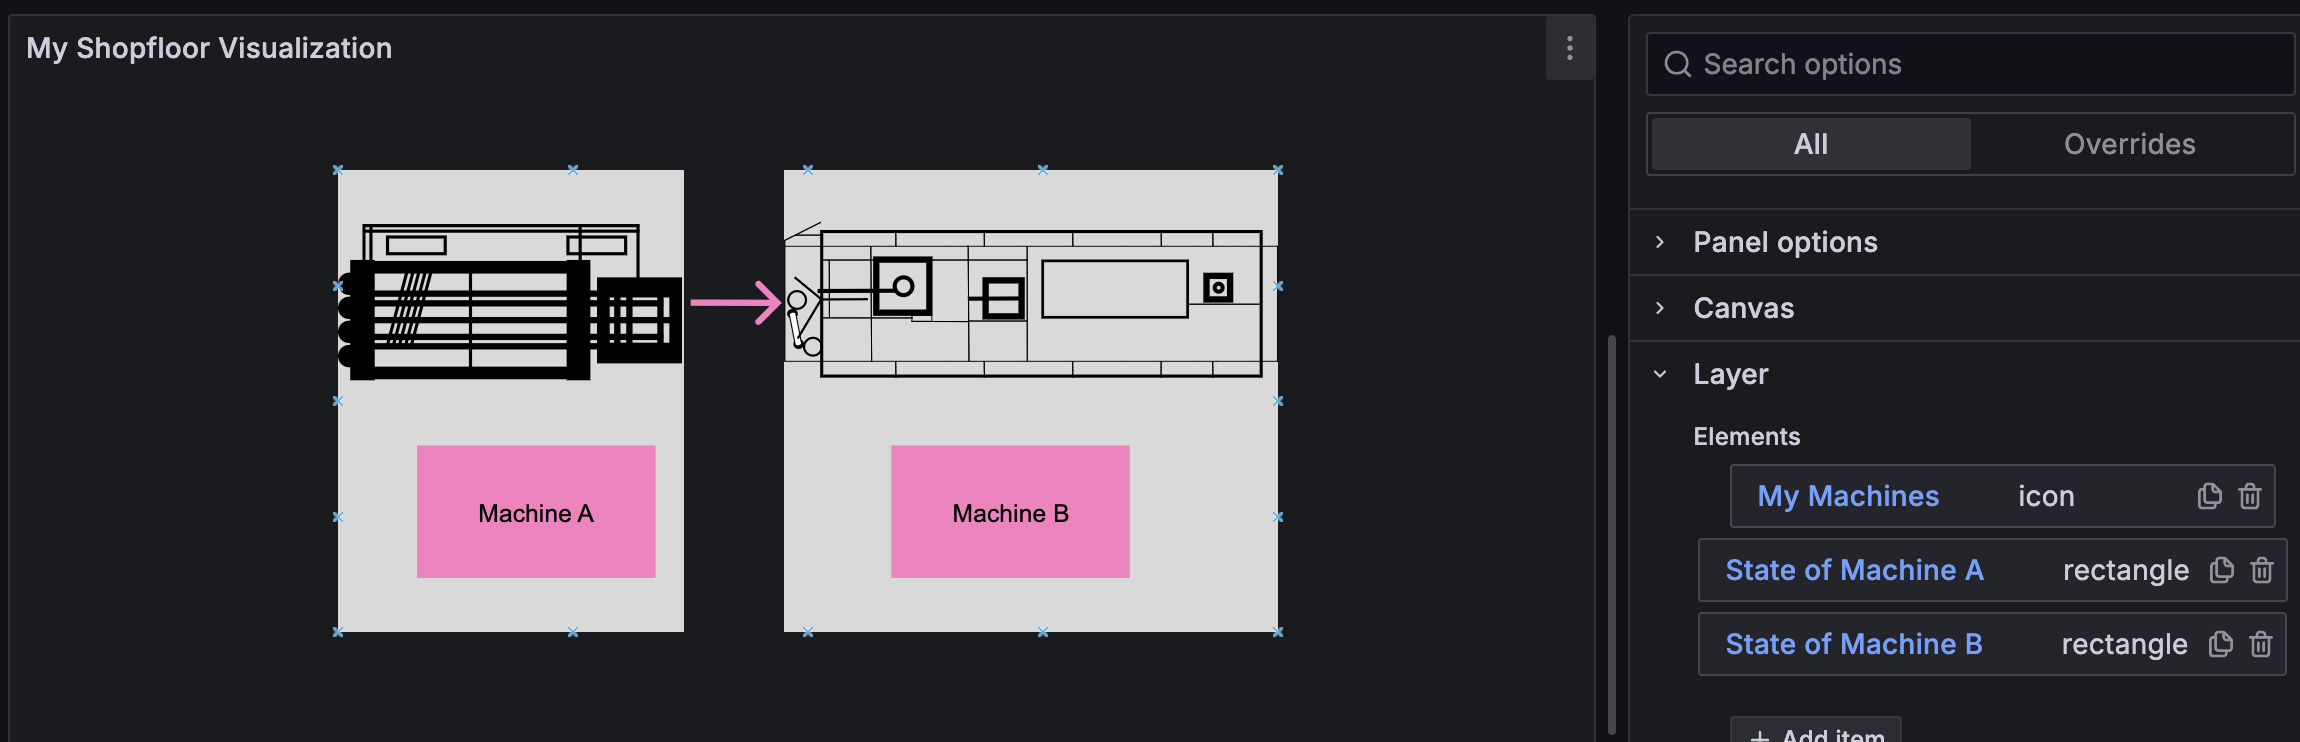
- Rename the default panel to “My Shopfloor Visualization” and delete the default canvas element.
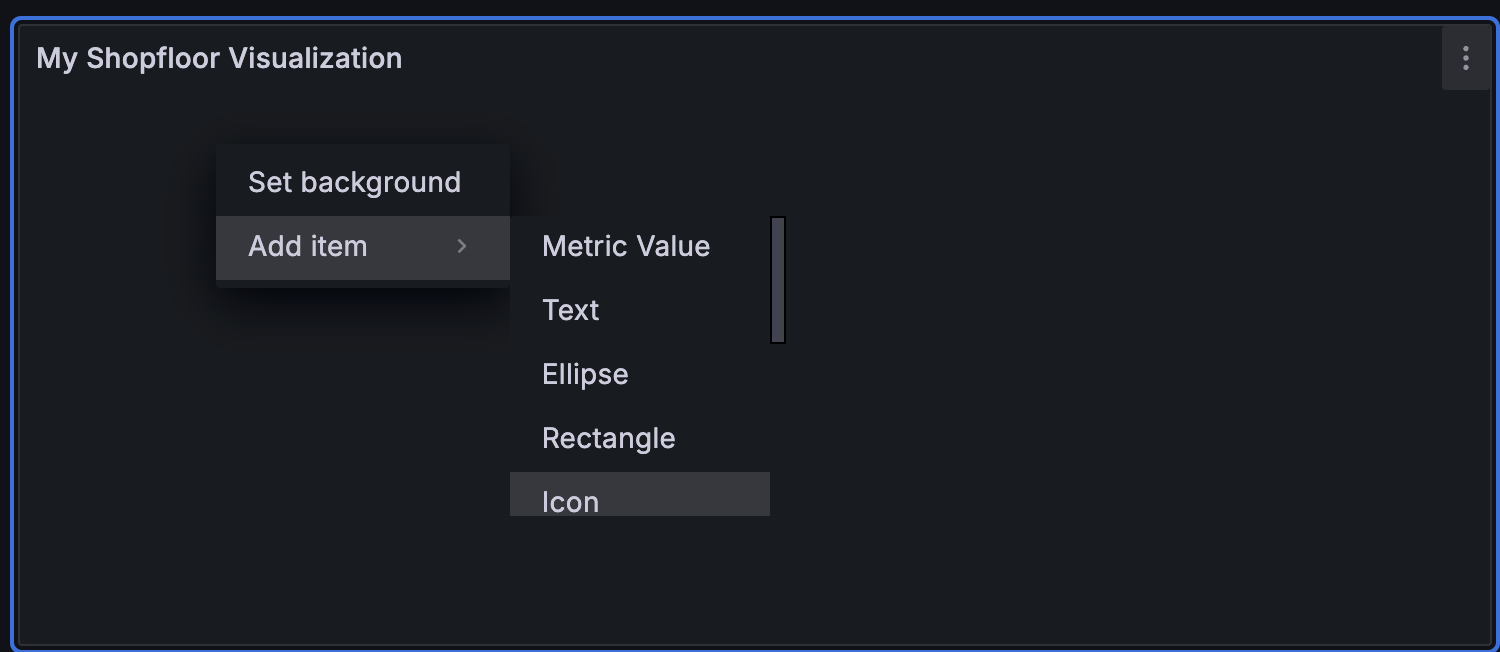
- Right-click on the empty canvas and add an Icon item to it.
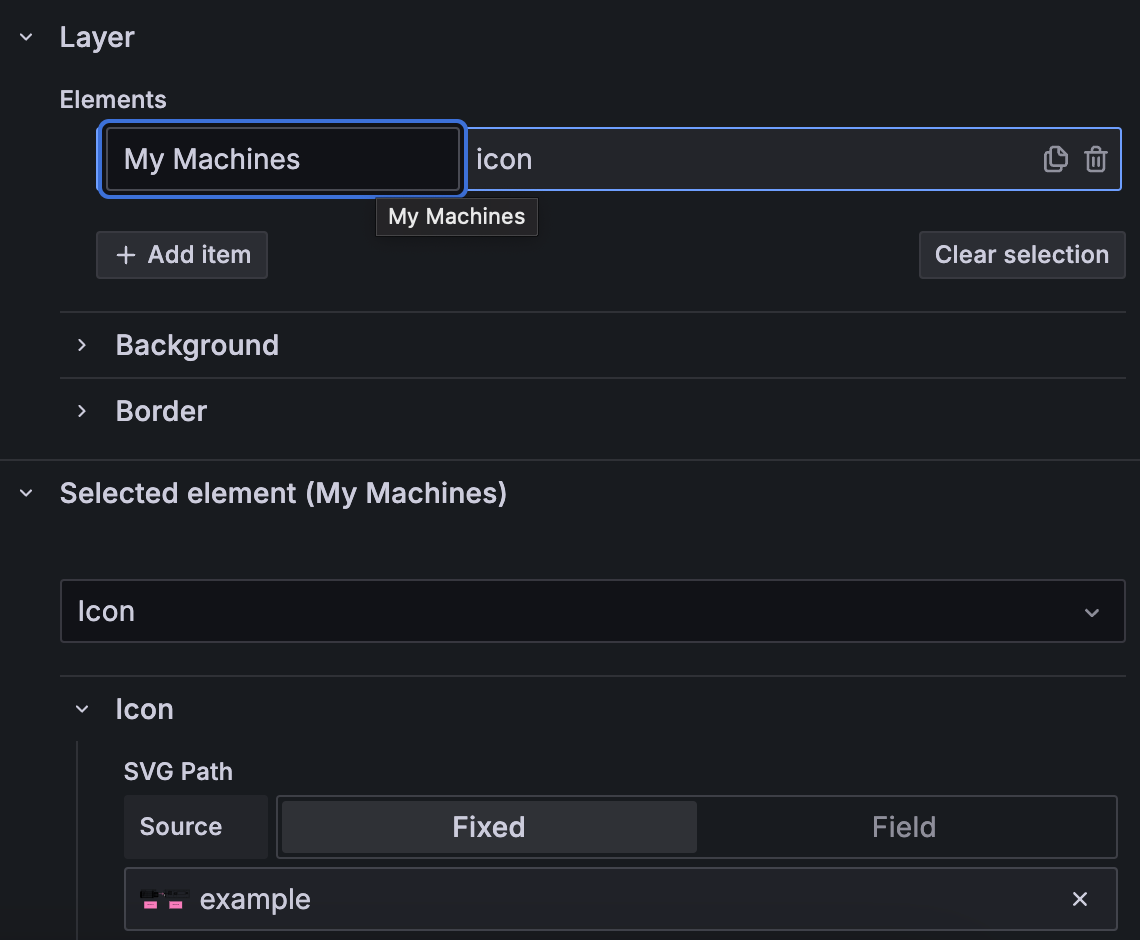
- Left-click the icon to edit its properties on the right side of the screen. By default, Canvas displays the icon with the name "element 1" as a question mark icon. Rename the icon and set its fixed source to the URL
img/icons/umhicons/example.svg.
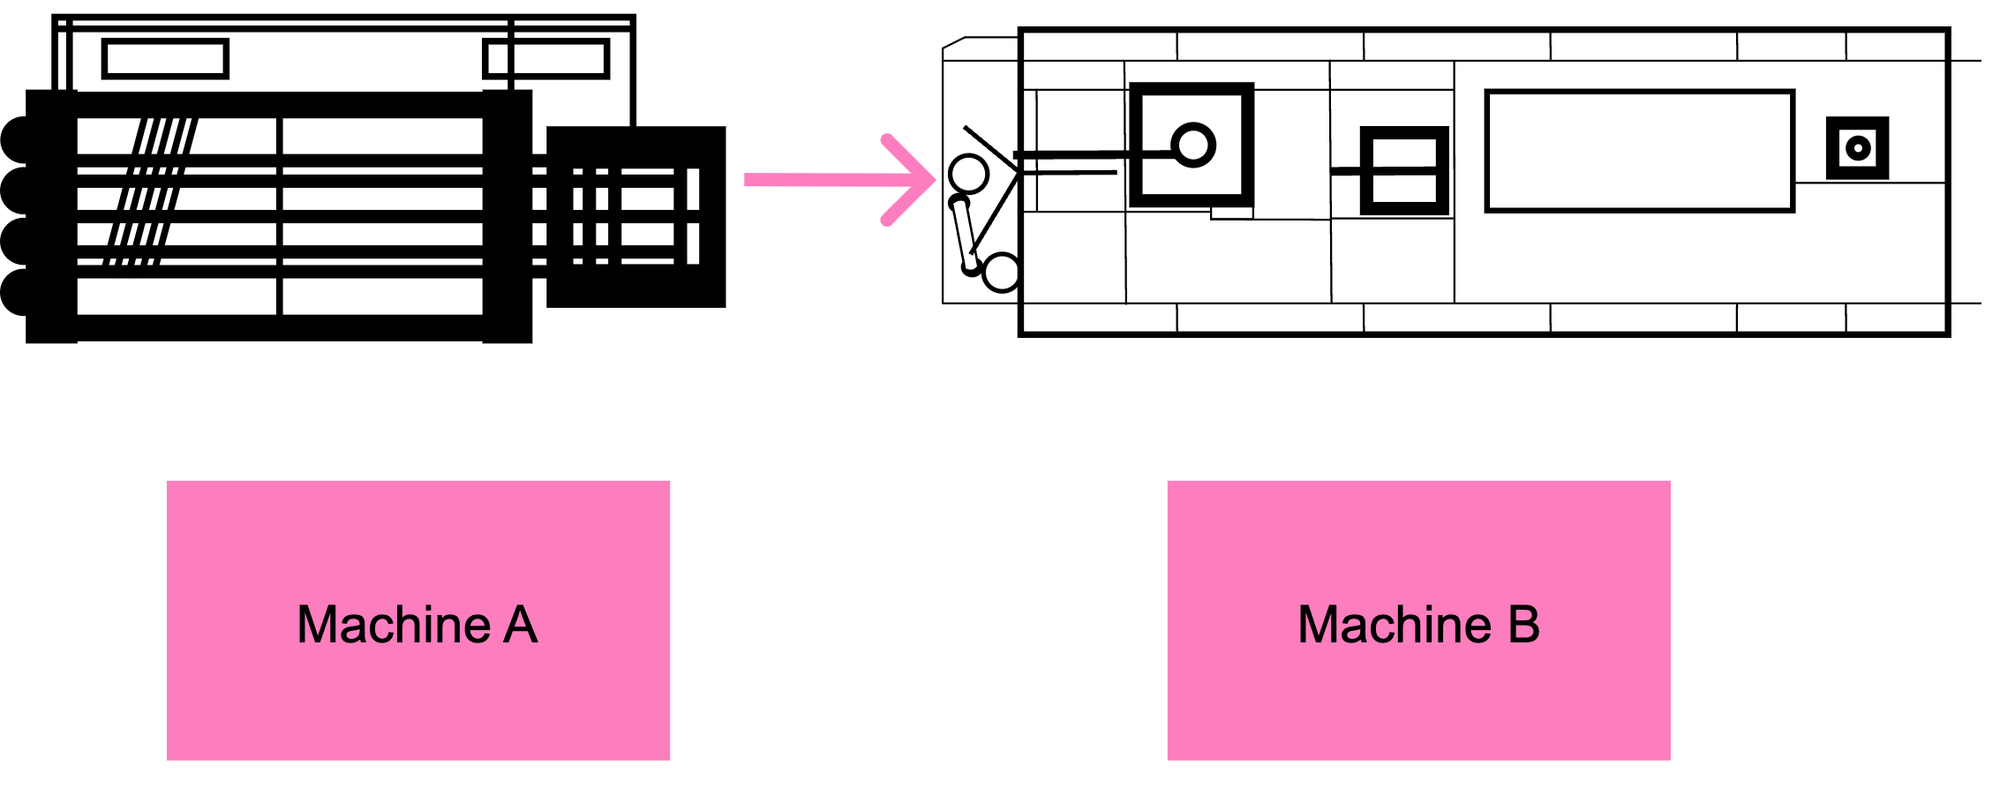
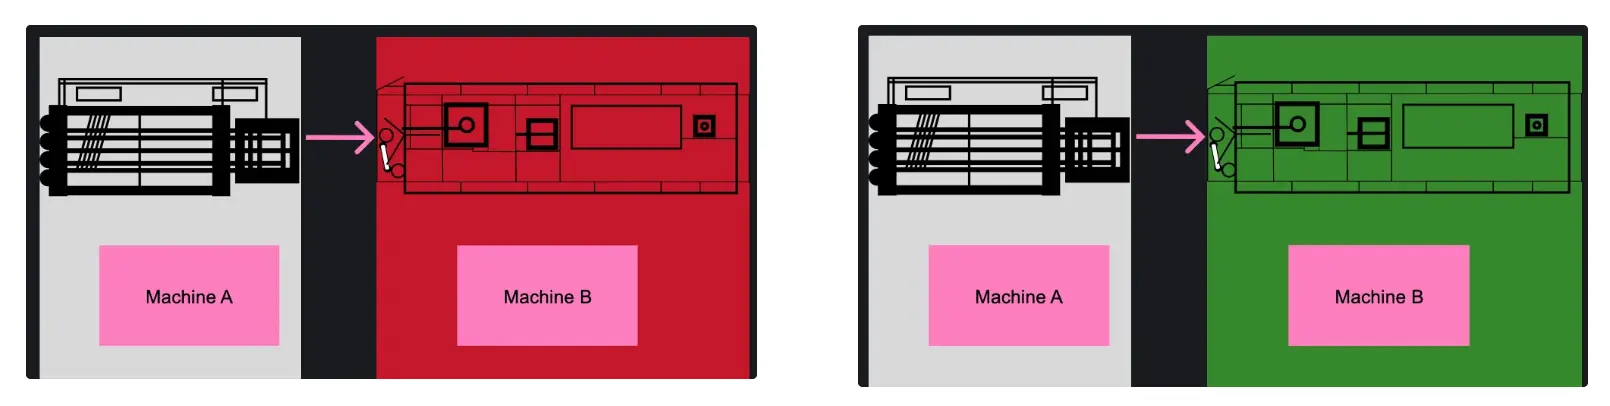
- Position two rectangles around Machine A and B which will be used to dynamically show the machine state.
Opportunities through data and logic integration
Suppose that Machine A and Machine B form a production line and Machine A is supplying Machine B with components.
Only machine B is connected to the United Manufacturing Hub and sends real time data to the UNS e.g., about its current state
Setting Up the logic of machine B
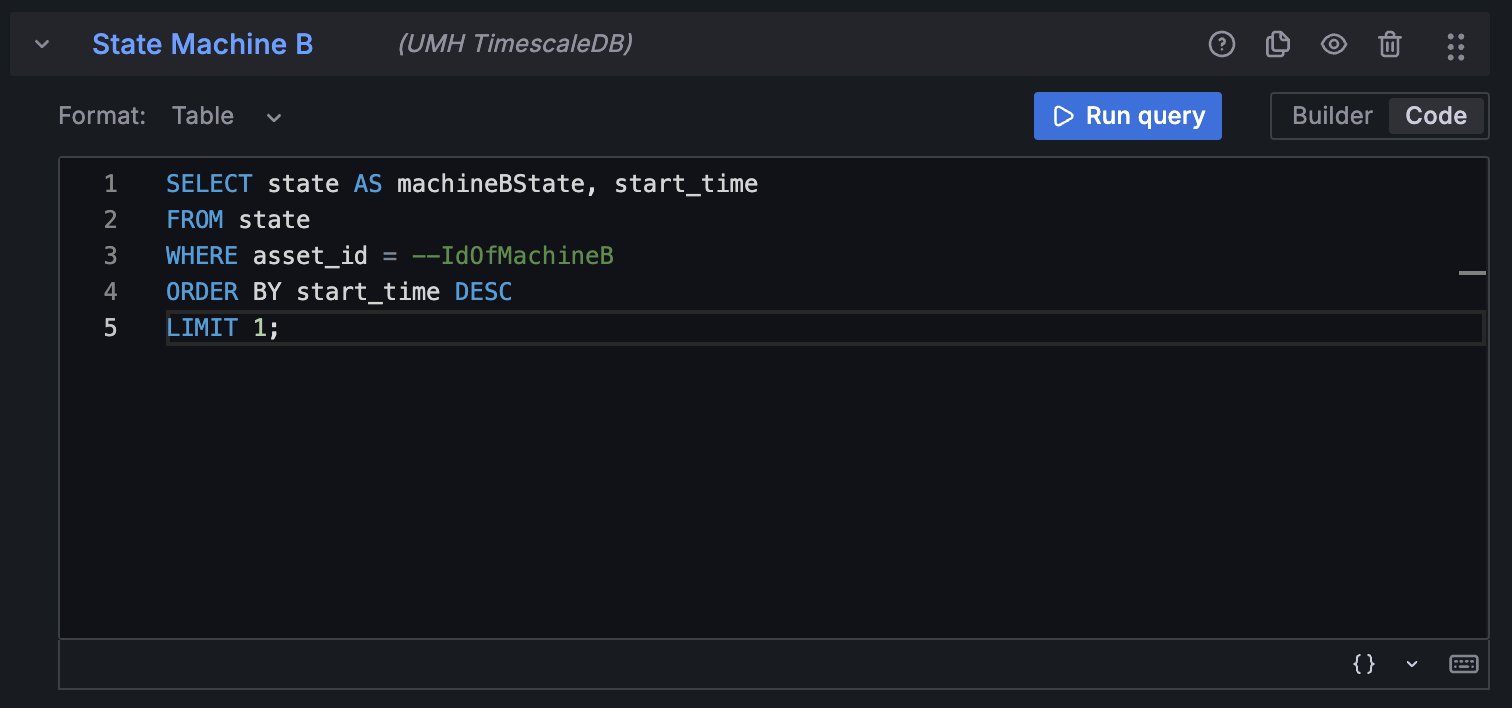
- Create a SQL query that retrieves the most recent state of Machine B.
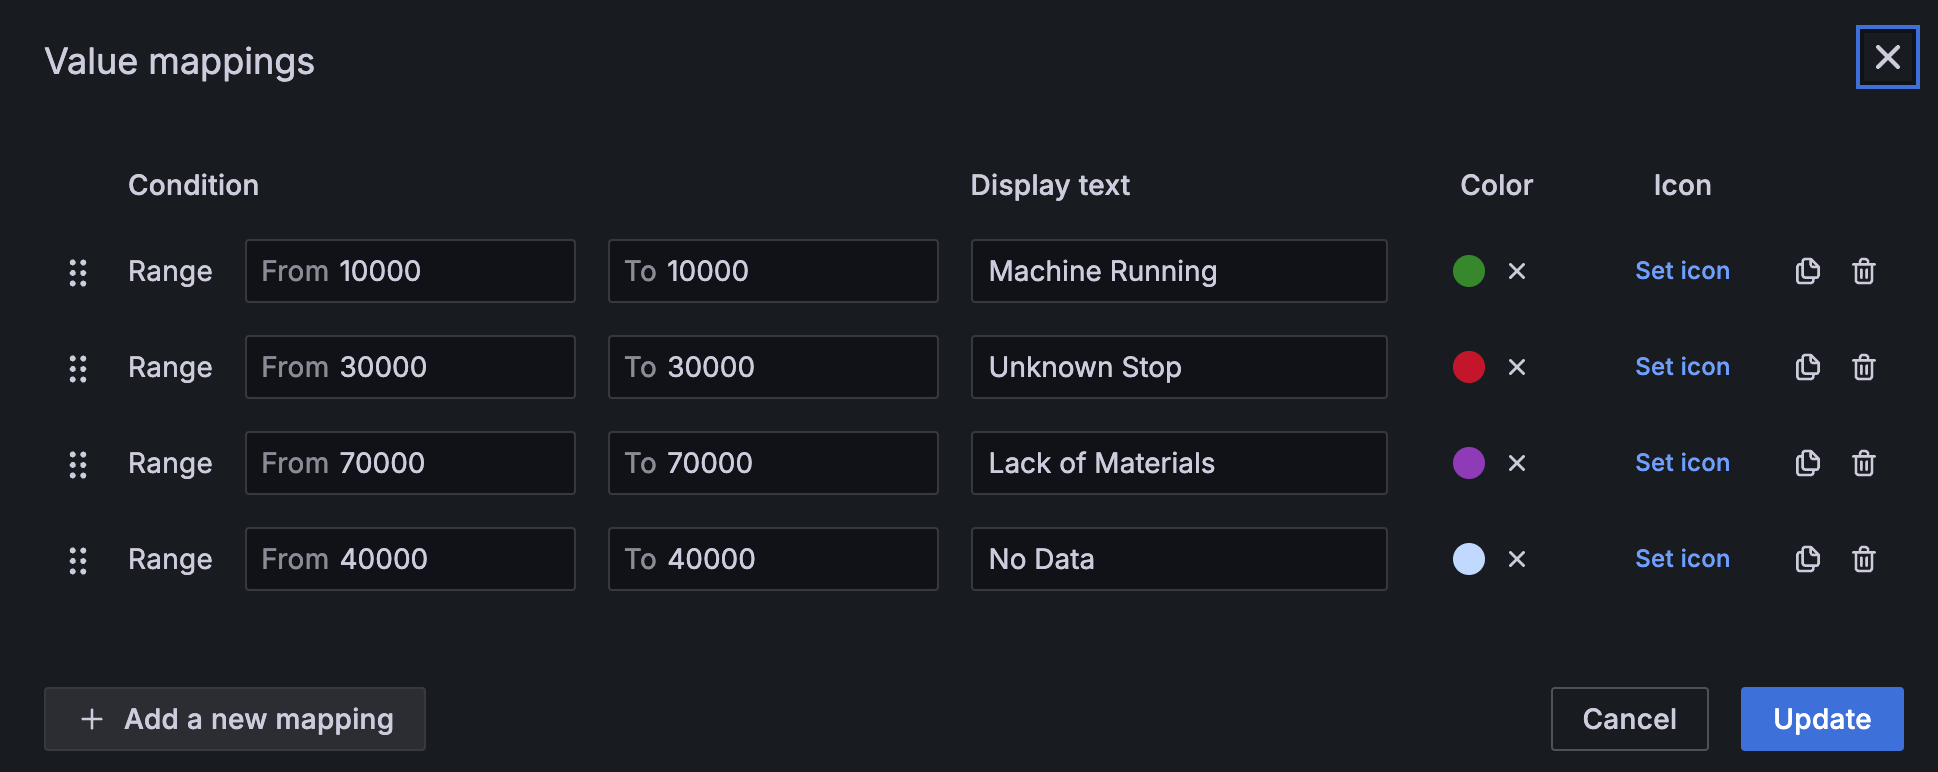
- Add value mappings to translate the codes returned by the query into corresponding colors and their meanings. The value mappings tab is located on the right side among the panel options.
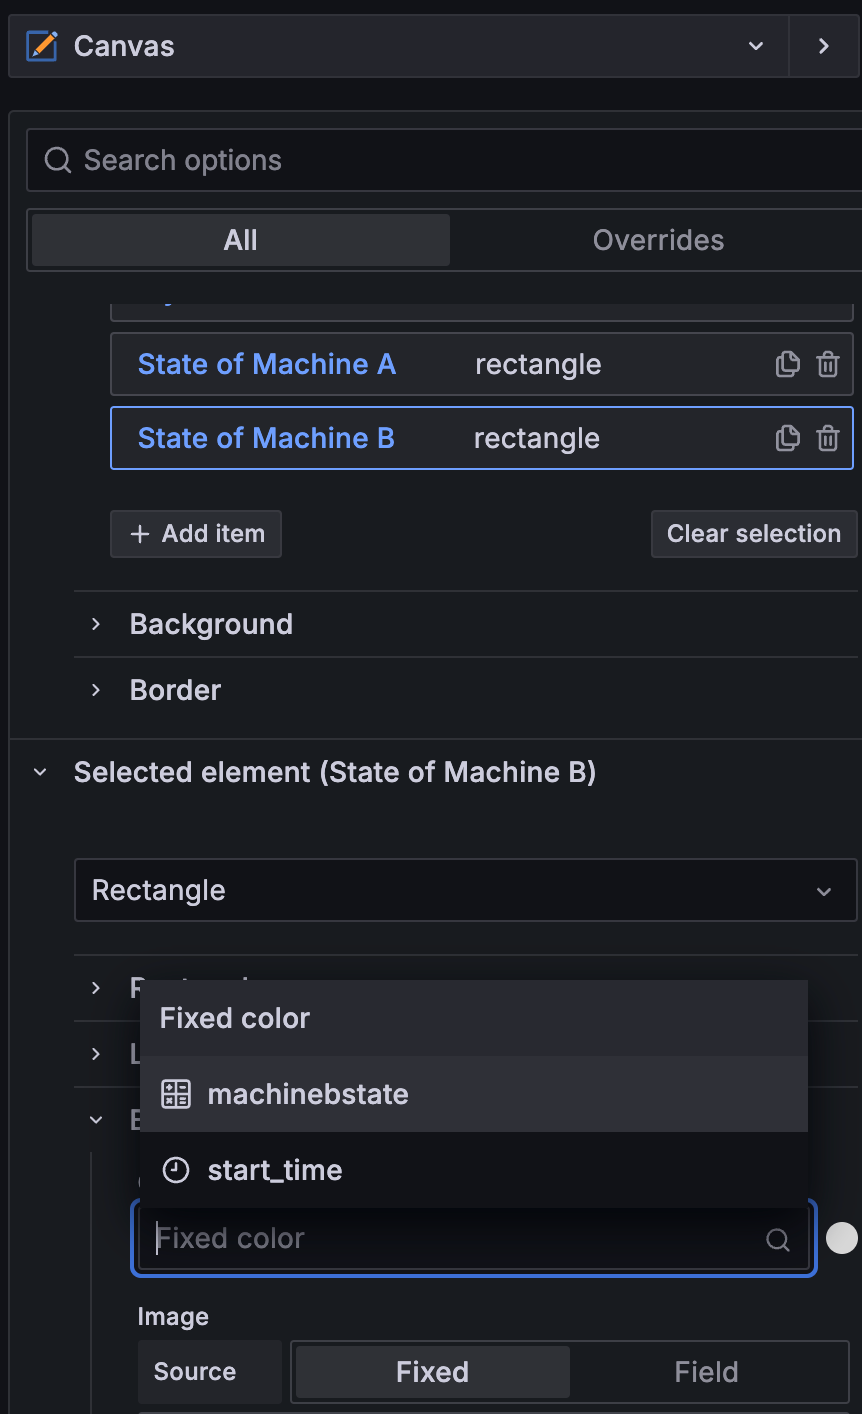
- Set the color of the Machine B state rectangle dynamically based on the value retrieved from the query.
- Dashboard representation:
- Red rectangle symbolizes an unknown stop of machine B.
- Green rectangle symbolizes that machine B is operating as expected.
- Possibilities for unlimited further color coding representing states such as cleaning, changeovers, or lack of materials to provide more detailed status information.
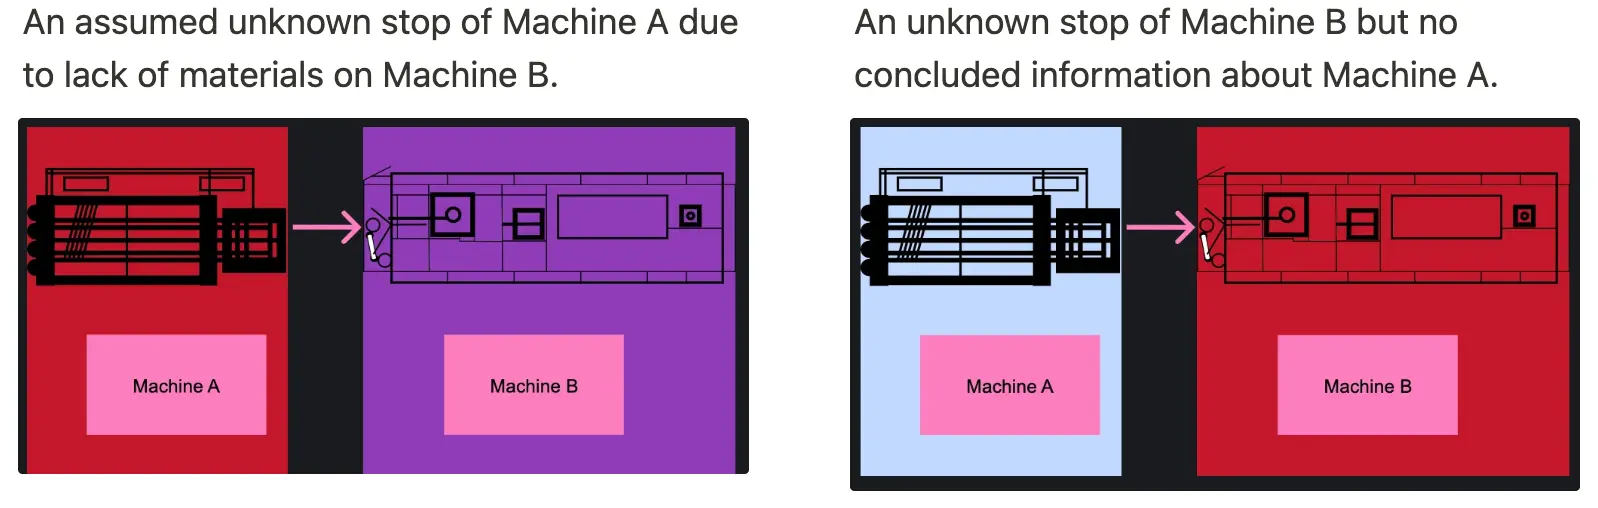
Implementing logic for Machine A
The UNS has no direct data about Machine A, but a logical inference suggests that Machine A might have broken down if Machine B reports a lack of materials, as Machine A supplies materials to Machine B.
- Add this query to the dashboard
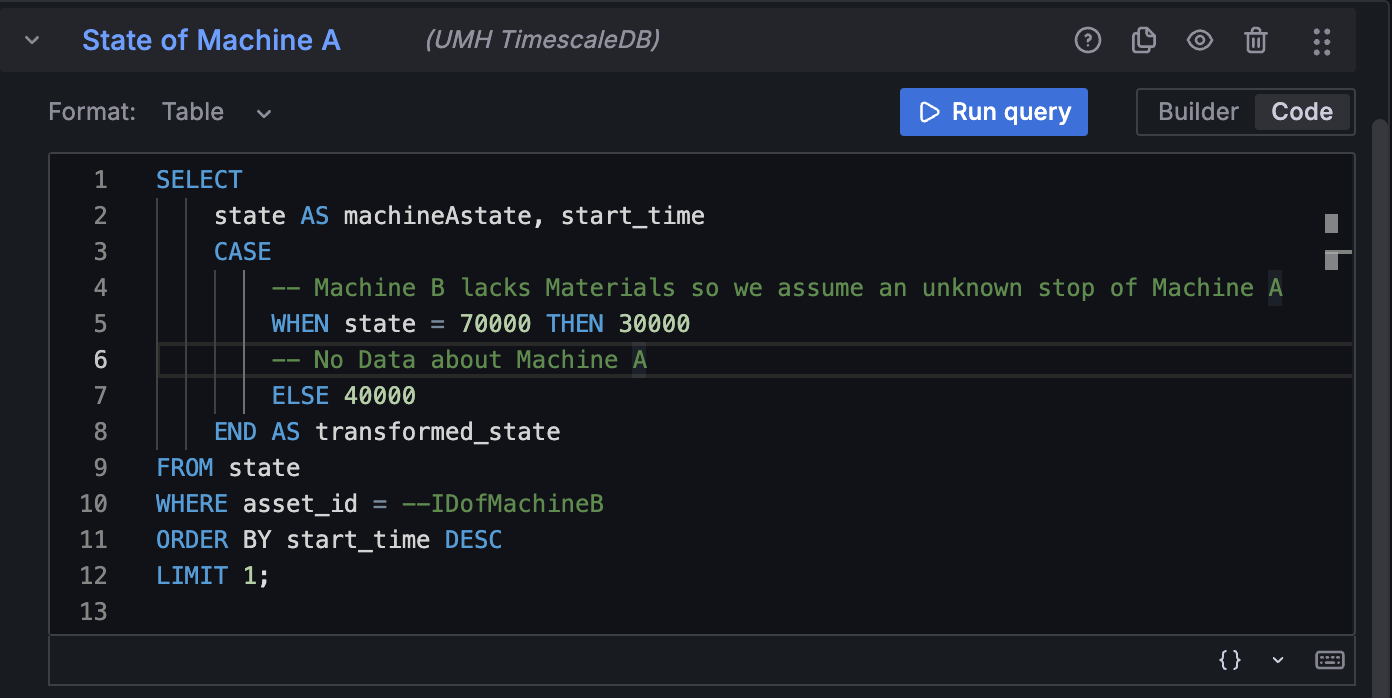
- Let the rectangle State of Machine A depend on the value of Machine A state
Conclusion
By following this guide, you've harnessed the power of Grafana Canvas and custom SVGs to create a dynamic, real-time dashboard that mirrors your production floor layout. This approach provides:
- Enhanced Visualization:
- Dashboards that resemble SCADA systems, offering immediate familiarity to operators.
- Custom layouts reflecting the actual production environment.
- Real-Time Insights:
- Integration of live data, allowing for rapid response to changing conditions.
- Implementation of logic to infer states of interconnected machines.
- Sustainable Configuration:
- Use of Node-RED and Kubernetes volumes ensures your setup persists across upgrades.
- Avoids unsustainable modifications to Grafana deployments.
Next Steps
- Expand Your Dashboard:
- Incorporate additional machines and data points.
- Implement more complex logic to reflect intricate production workflows.
- Share with Your Team:
- Demonstrate the enhanced dashboard to operators and decision-makers.
- Gather feedback to further tailor the dashboard to your team's needs.
- Stay Updated:
- Keep an eye on updates from UMH and Grafana for new features and improvements.
- Engage with the community to share experiences and learn from others.
IT / OT Integration Platform for Industrial DataOps
Connect all your machines and systems with our Open-Source IT/OT Integration Platform to make all shop-floor data accessible at a single point.