Kowl is a powerful tool that is preinstalled with the United Manufacturing Hub. It allows you to easily inspect and understand the messages that are structured by their topics in your Kafka environment. With Kowl, you can gain valuable insights into the data flowing through your Kafka clusters and make informed decisions about how to process and analyze this data. In this tutorial, you will learn how to access Kowl using UMHLens and start exploring the messages in your Kafka environment. Whether you are new to Kafka or an experienced user, this tutorial will provide you with the knowledge and skills you need to effectively use Kowl to inspect your Kafka messages.
Instructions
Step 1: Accessing Kowl
- Open UMHLens.
- Open the cluster whose messages you want to explore.
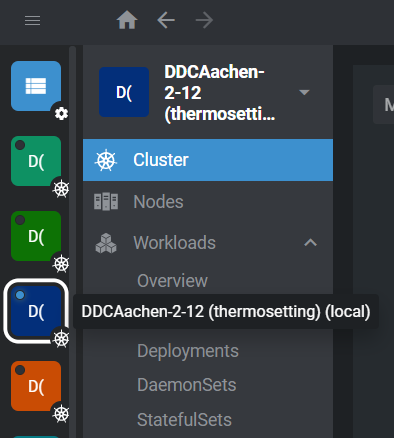
- On the left side, click on Workloads and then on Pods.
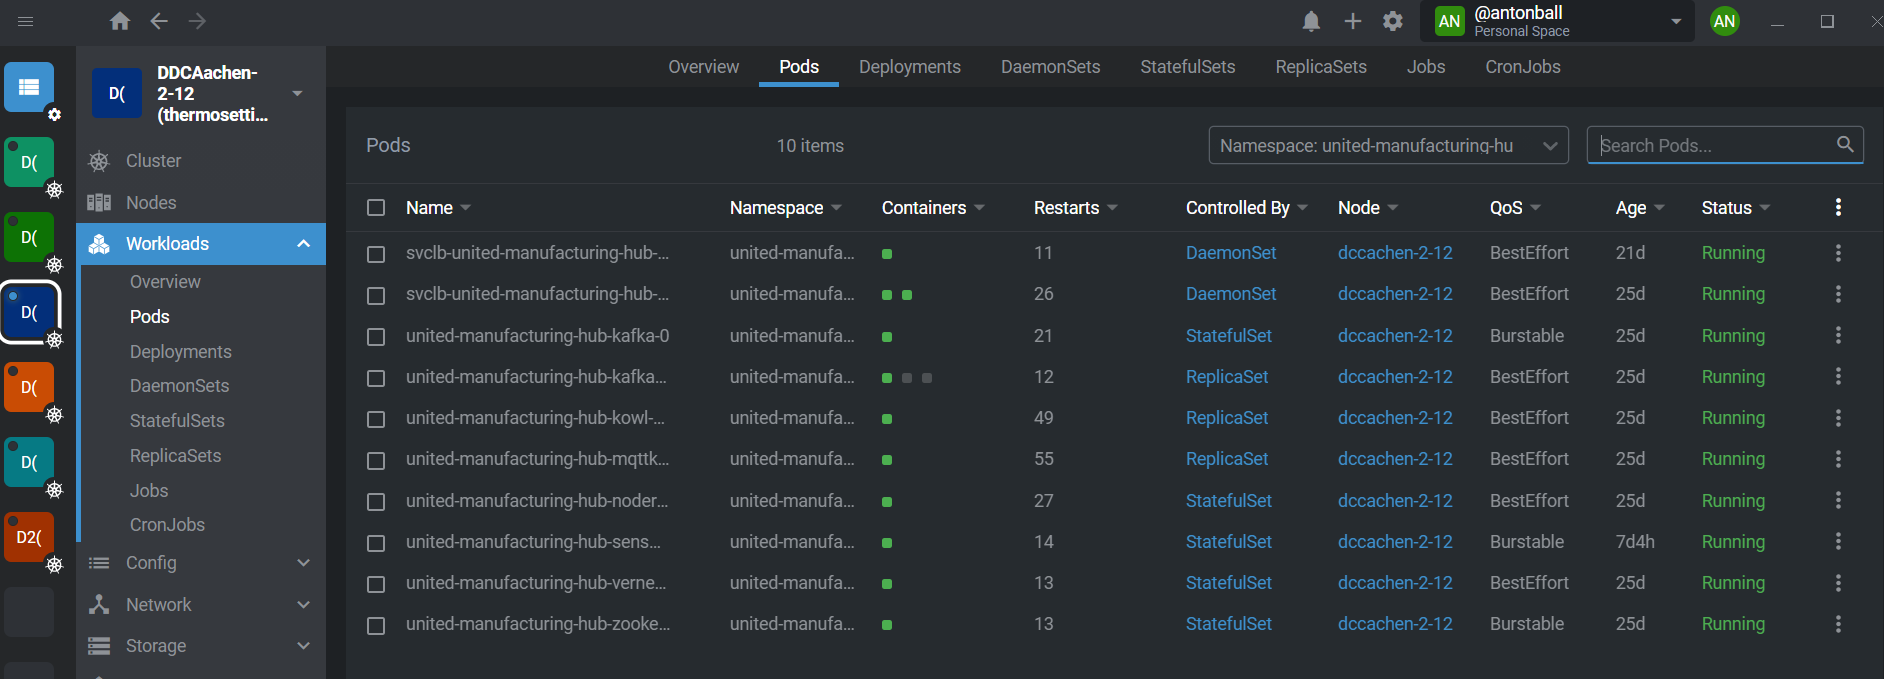
- Choose "united-manufacturing-hub" as namespace, then find the kowl-pod: united-manufacturing-hub-kowl-some_number.
- Click on it, go on the right side and scroll down to Containers and then choose Ports.
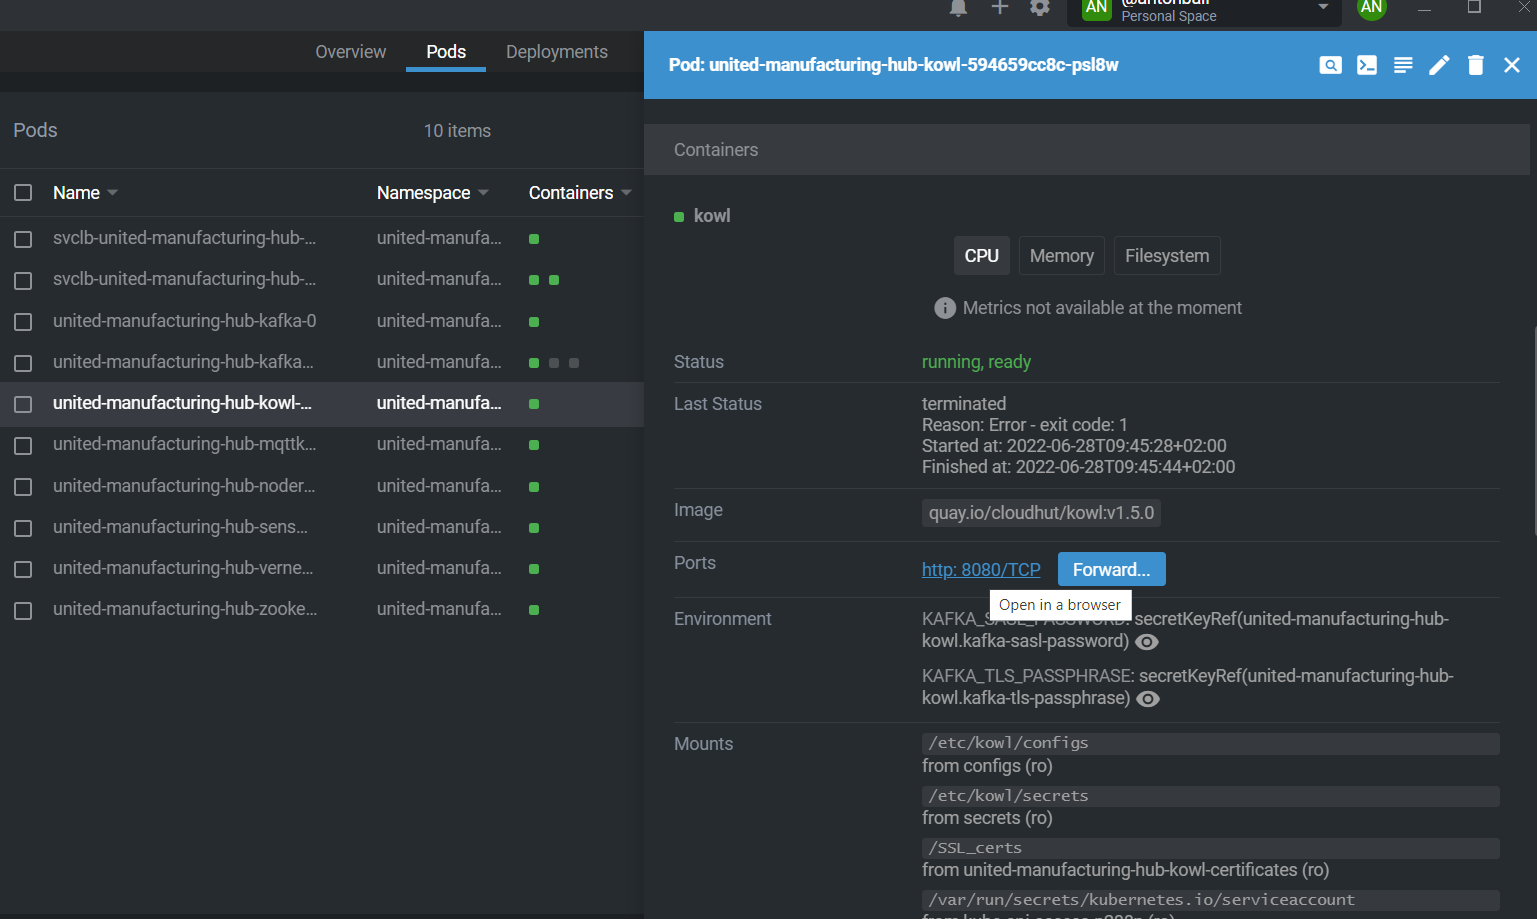
- Click on the http: 8080/TCP.
- Kowl opens automatically in the browser!
Step 2: Inspect Messages
Follow these steps to inspect Kafka messages efficiently in Kowl:
-
Are all relevant topics existing? And do they have a size larger than 0?

In this example, we see the weaving has some connection problem as there is no message stored under the topic /state (size = 0).
-
Have a look at the total partitions: these shall be less than 300 max.!

-
Have a look at the consumer groups. Does any group have a rising lag?

In this case the mqtt-kafka-bridge has a little lag. But it is not rising. So it’s fine. The messages get processed.
-
Open each consumer group and inspect it in detail. Here you can see the lag of each topic separated. Find out which topic is responsible for the lag you've got, in case you have a rising lag.

-
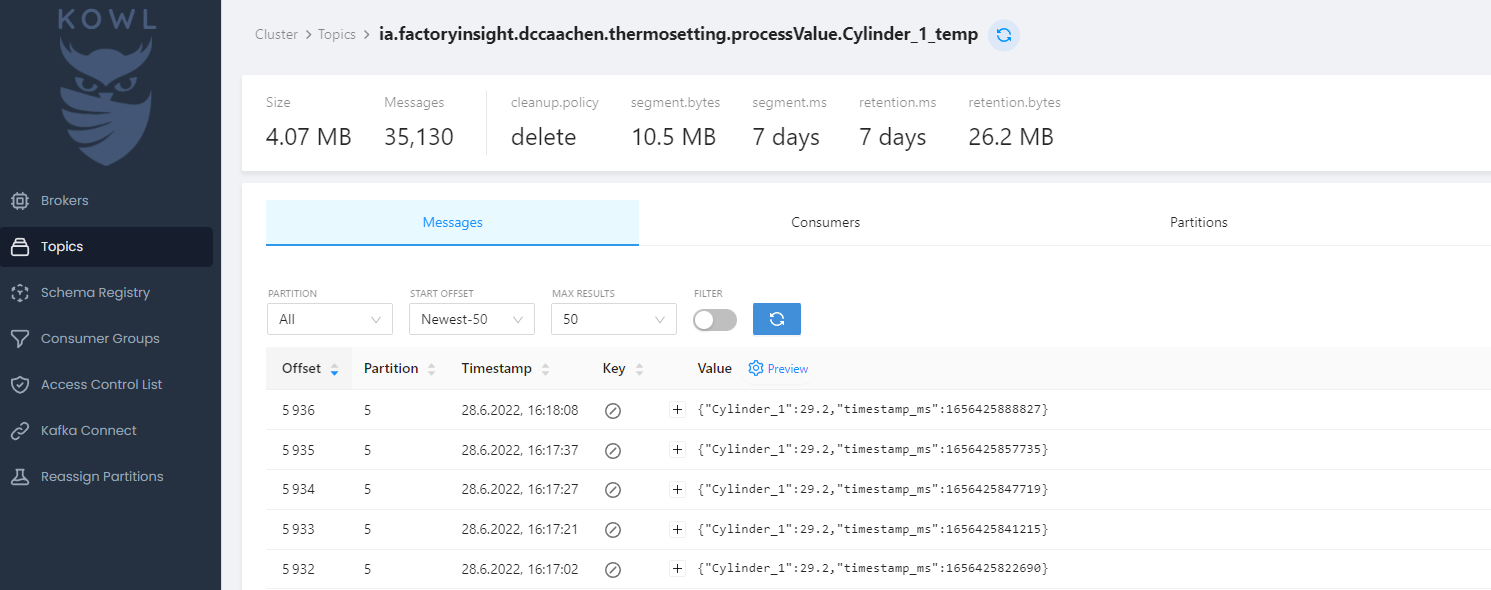
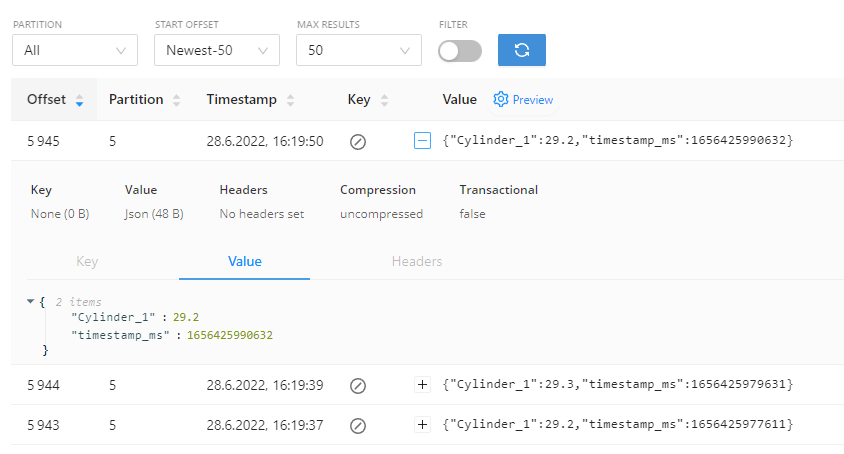
If one topic has a rising or steady high lag, press view topic on the right side. Now you see all the messages arriving under the chosen topic. You can inspect if these are the right messages.
-
Press the minus between key and value in the list to get a detailed view for each message. Have a look at the header here. If there is any reason for not accepting the messages, it would be written here.
-
When positioned under topics on the left side, scroll down and have a look at all the putback error topics. These should have a size of 0. Any other number is a sign of an error. (Skip this part if you can't see any topic named like this.)


