


This tutorial provides step-by-step instructions on how to use Grafana Canvas together with the United Manufacturing Hub. Check out the official documentation of Grafana Canvas for more information.
Requirements
- Canvas comes pre-installed with Grafana version 9.3 (which is the default in the UMH version 0.9.11), so make sure you are using that version or a newer version.
- Additionally, you need an image of your shopfloor (or any other image where you want to show visualizations on top) available as a link. Grafana Canvas does not support uploading images yet, but you could either upload it somewhere on the internet and link it, or use Node-RED to host your image
- You need to have your datasources connected and available as “processValues” in the UMH
Tutorial
-
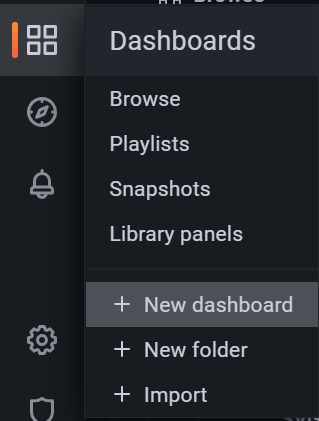
To access Grafana and log in, you'll need to obtain your grafana-secrets. These can be found by navigating to OpenLens→Config→Secrets in UMHLens. For more information on how to retrieve these credentials, you can refer to the tutorial Getting started on data visualization with Grafana. Once you have your grafana-secrets, open Grafana and click on the Dashboards tab. From there, select the option to create a new dashboard and add a new panel.
-
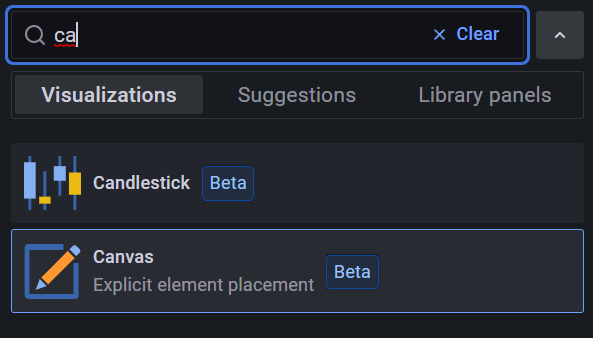
Select on the top right canvas under visualizations.
-
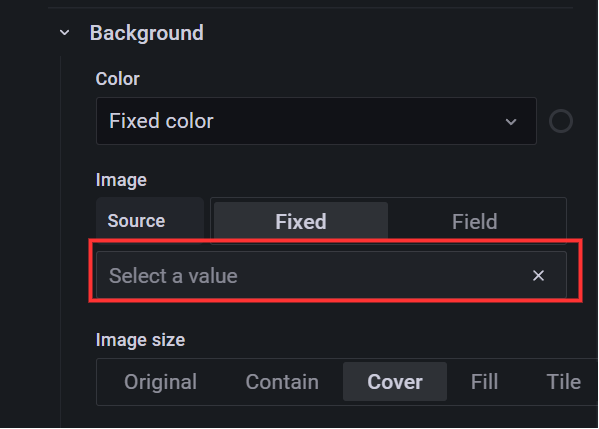
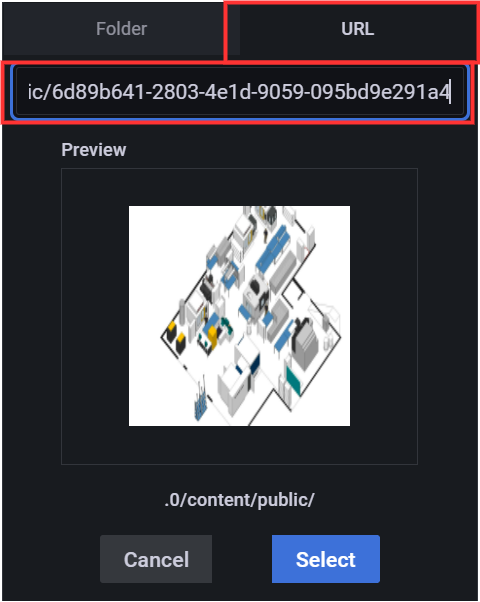
To add a virtual shop floor as the background in your Grafana Canvas visualization, go to the "Background" section on the right side of the screen. Click on "Select a value" and then choose "Url" from the options. Enter the URL of your shop floor image in the provided field. Note that Grafana Canvas currently does not support uploading images, so the only way to add a background is by using a URL.
-
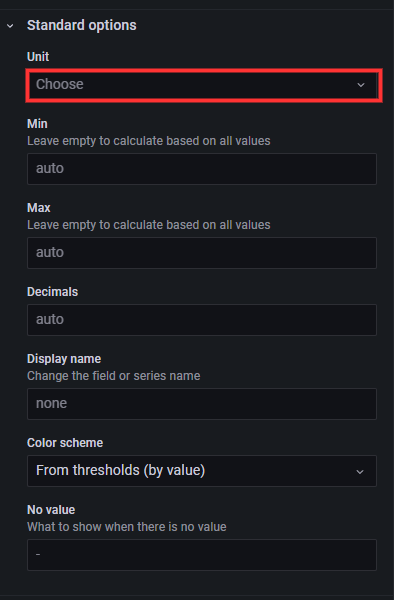
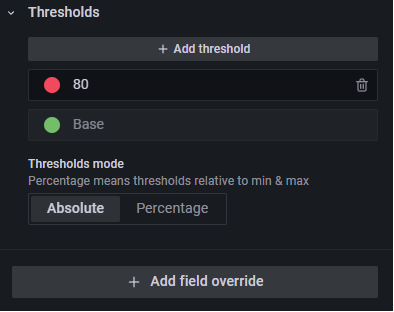
To customize an element in your Grafana Canvas visualization, select it and then use the customization options available on the right side of the screen. These options may include adding a unit, setting a threshold value for color changes, and more. By adjusting these options, you can tailor the appearance and behavior of your element to meet your specific needs.
-
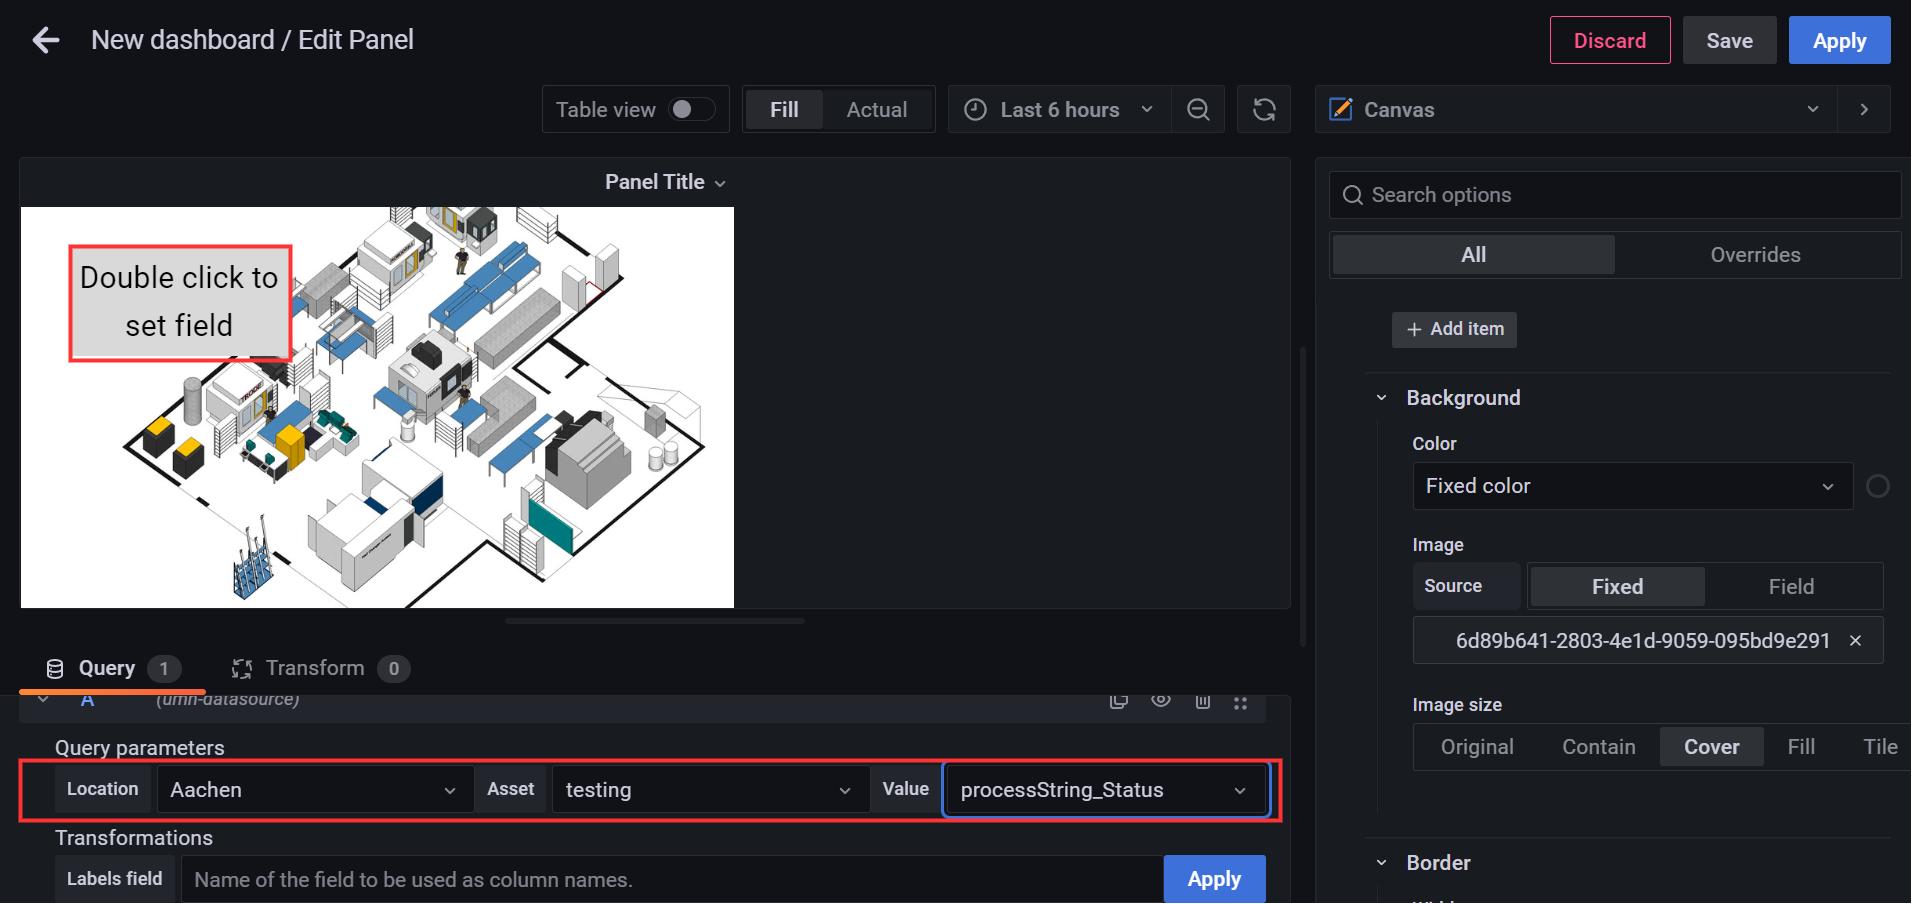
To display data on your virtual shop floor in Grafana Canvas, you'll need to set up a query. Begin by selecting or adding your relevant topics under the "Query parameters" section, and then click "Apply". Then, double click on the field (element) on your shop floor and select the query you want to use. This will retrieve and display the data you've selected on your shop floor visualization.
-
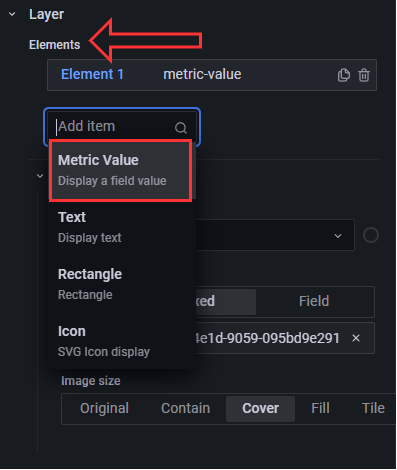
Once you've finished customizing your virtual shop floor in Grafana Canvas, you can add additional elements to further personalize your visualization. To do this, navigate to the "Elements" section under the "Layer" menu on the right side of the screen. Here, you can add new elements such as "Metric Values", "Texts", "Rectangles", or "Icons" to your shop floor. These elements can be customized using the options available on the right side of the screen, allowing you to create a fully personalized shop floor dashboard.
Summary
Grafana Canvas is a powerful plugin for creating custom visualizations and overlaying data on images within Grafana. It is especially useful for creating "shopfloor dashboards" and is easy to set up with the right requirements and following the steps in this tutorial.


