


Monitoring and troubleshooting MQTT messages is important for ensuring data transfer is successful. In this tutorial, we provide two options to set up the MQTT broker, including a quick fix using Node-RED and a more sophisticated approach using MQTT Explorer. By following these instructions, you can learn how to set up all machines and servers, allowing you to monitor and troubleshoot the message transfer effectively.
Instructions
Option 1: In Node-RED
- Use the debugger node and debugging window to monitor the MQTT messages.
Option 2: Using MQTT Explorer
- Install MQTT Explorer on your device.
- Open the app and add a new connection.
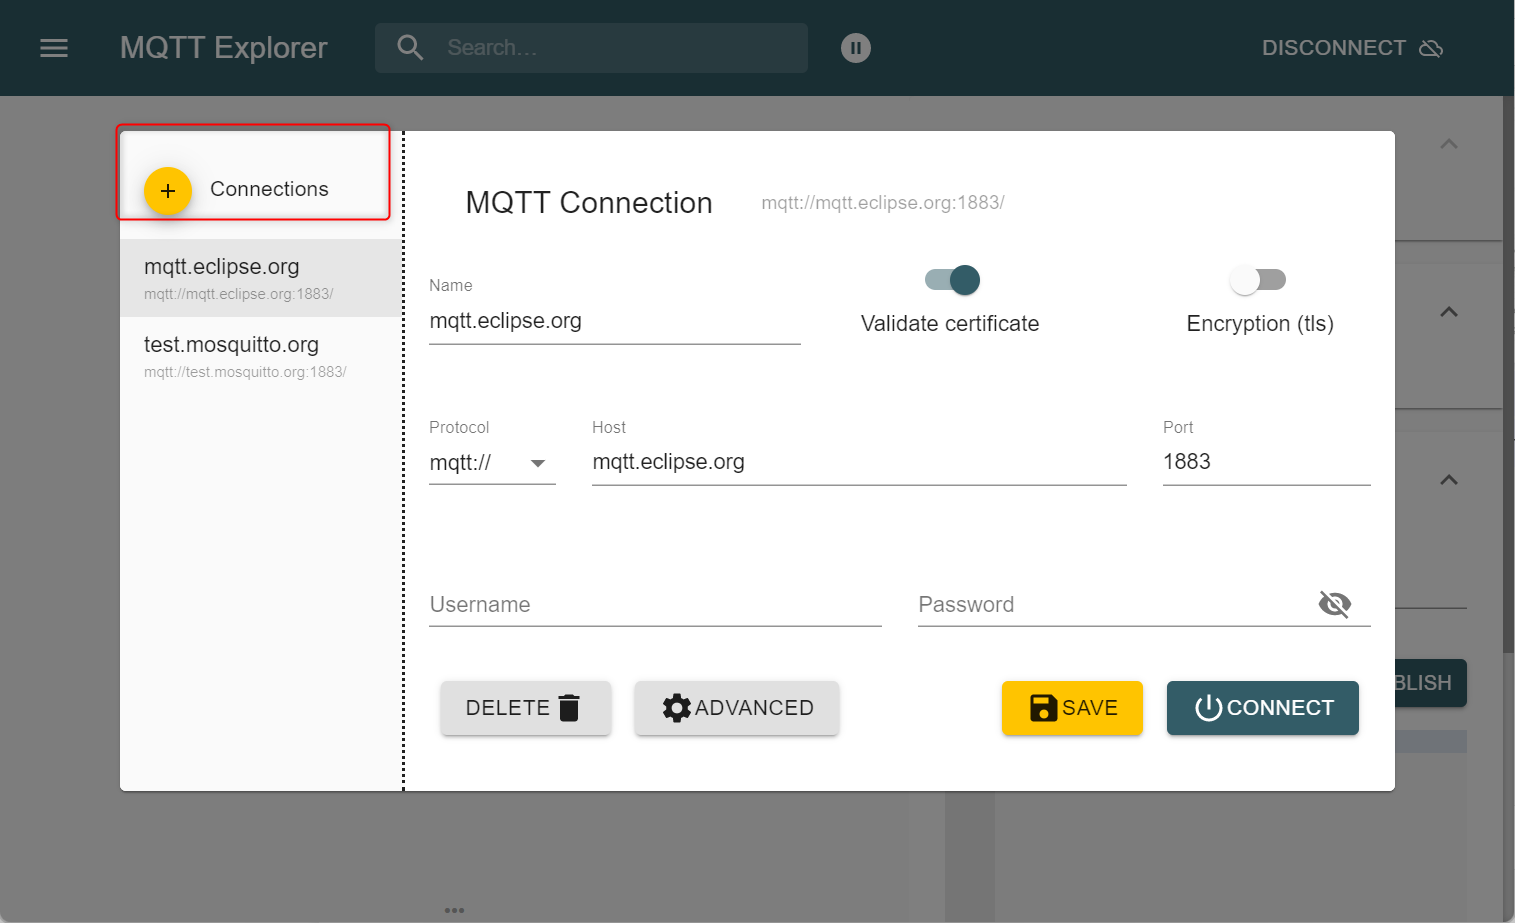
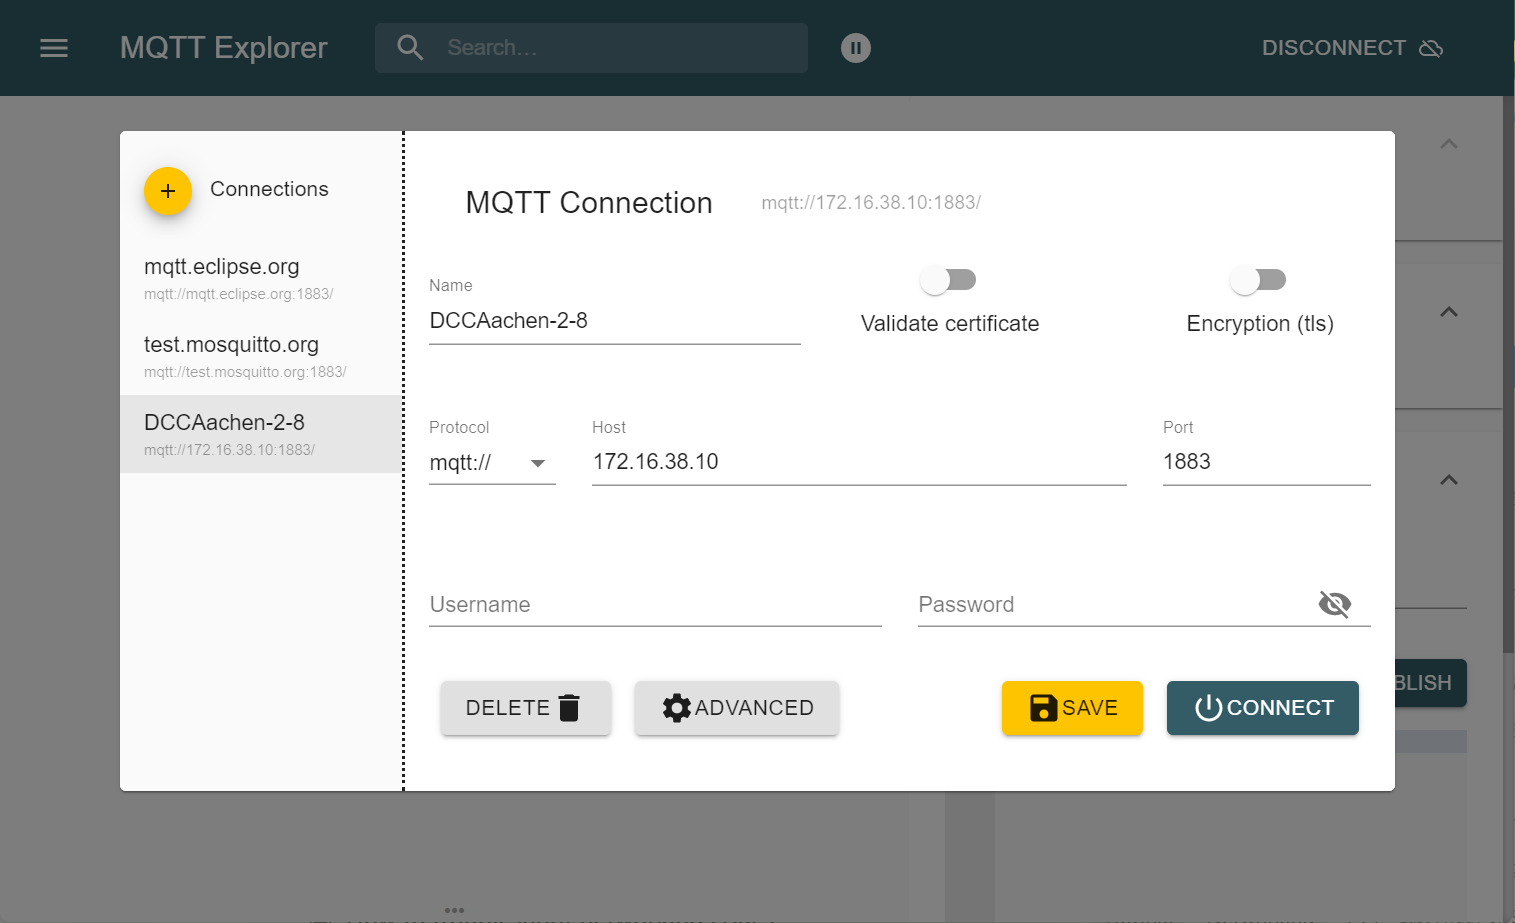
- Enter the name and IP address of the MQTT broker (usually the IP of the edge device).
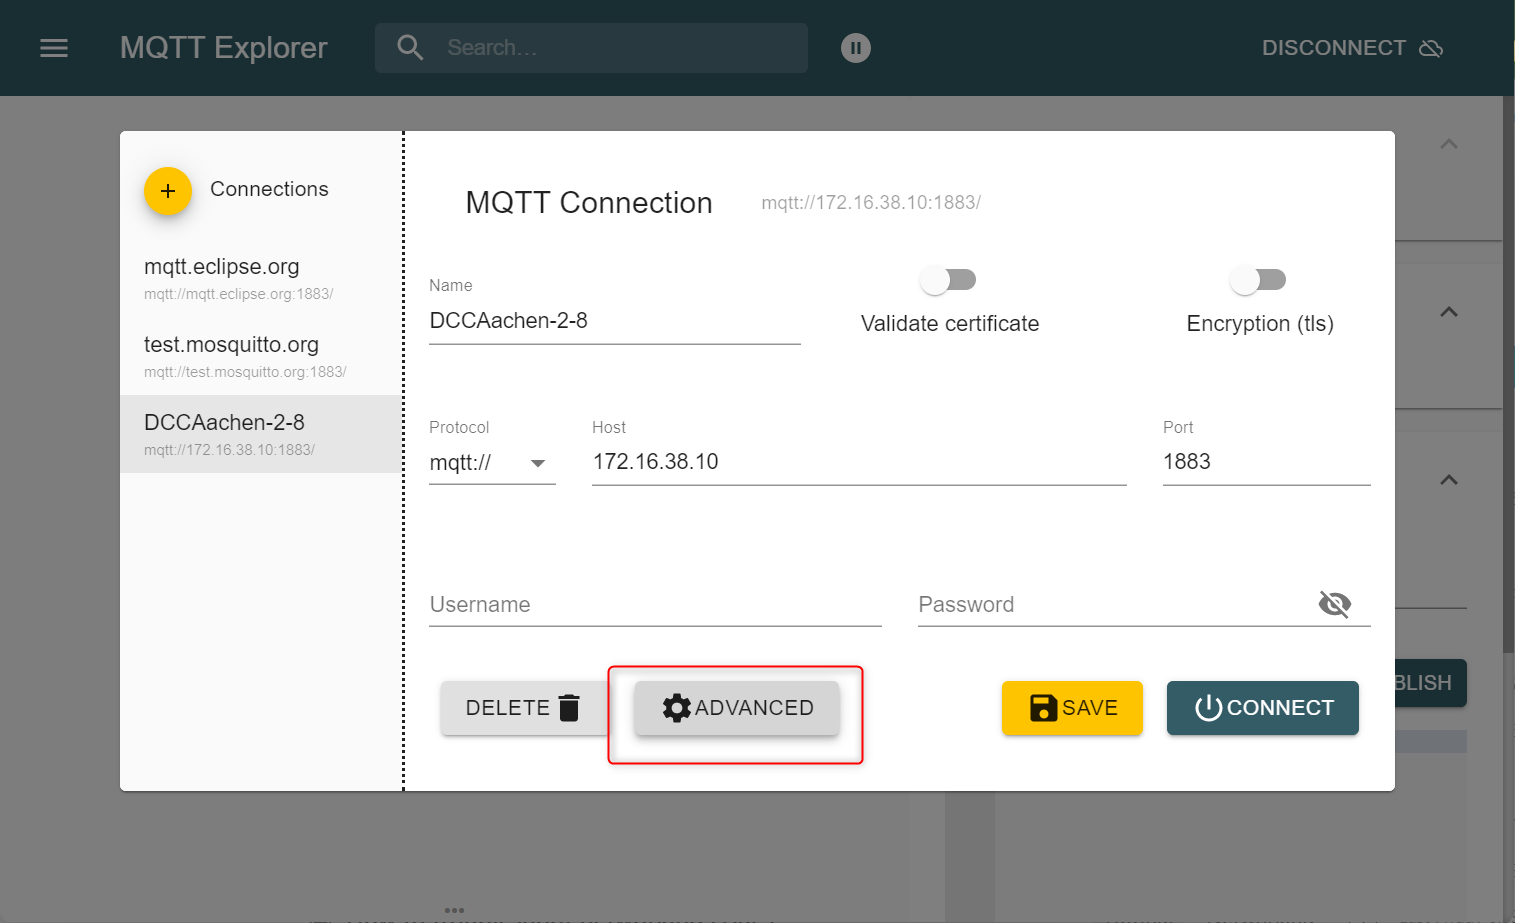
- Go to Advanced settings and remove the topic with #.
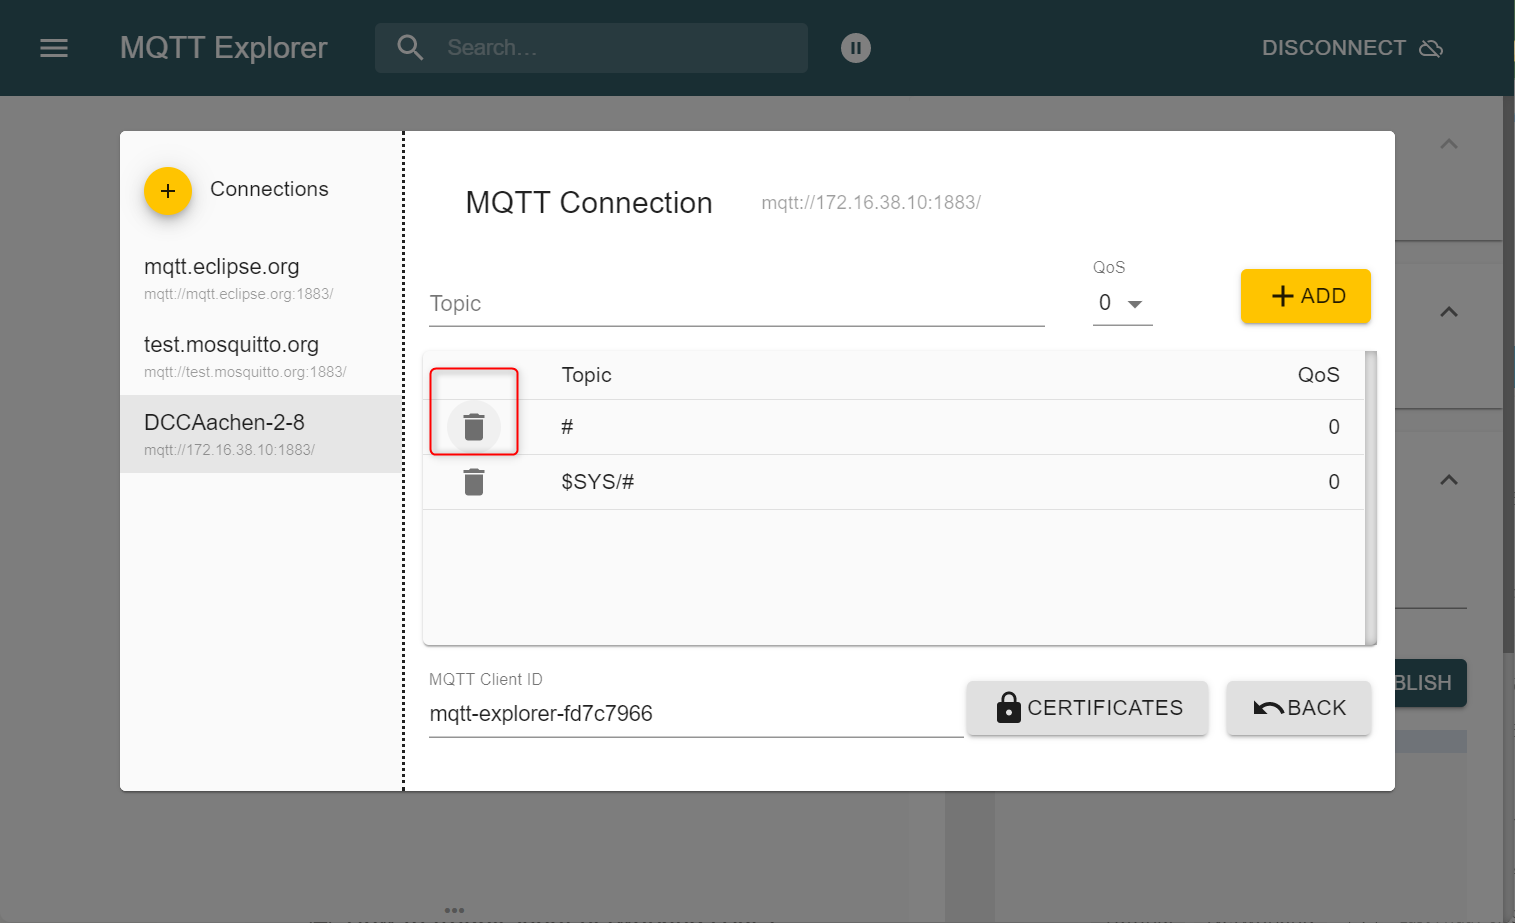
- Create a new topic with ia/#.
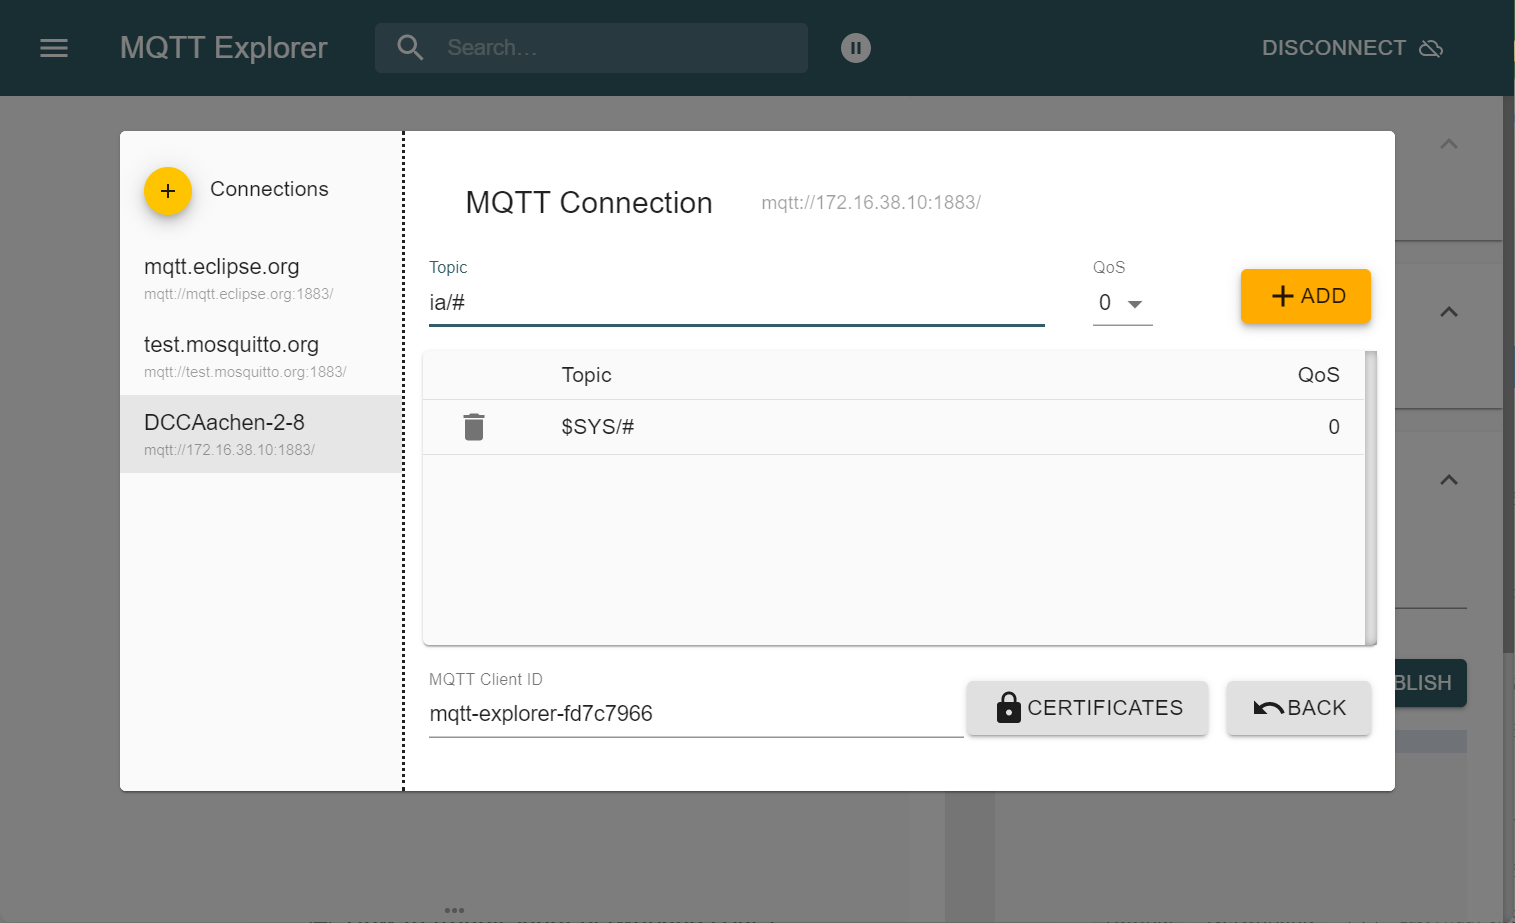
- Save the settings and connect.
- Repeat the setup process for all machines and servers.
⚠️
In older versions of the stack, adjust the username to be
ia_nodered if needed.
IT / OT Integration Platform for Industrial DataOps
Connect all your machines and systems with our Open-Source IT/OT Integration Platform to make all shop-floor data accessible at a single point.


