In the current age of Industrial IoT, historians like OSIsoft PI or Canary sometimes seem dusty and expensive, especially when compared to modern time series databases like InfluxDB, TimescaleDB, or the cloud equivalents of AWS and Azure. Especially for people coming from IT backgrounds, the benefits of a data historian compared to the scalability of modern databases are hard to grasp.
Nonetheless, many companies continue to rely on historians, often in combination with modern IT databases. So there must be something to this.
We've also noticed an interesting trend among some of our customers: OT engineers in particular seem to be using InfluxDB. If you're familiar with our last database article, you'll know that we're a staunch advocate of TimescaleDB over InfluxDB because TimescaleDB is much more "boring", scalable and reliable, and already includes the very likely needed SQL database anyway.
We went down the rabbit hole, analyzed the situation and came to the following conclusion:
Using a Historian is less about the performant and scalable data storage and more about the interaction with the data. Here the difference between a Historian / InfluxDB and TimescaleDB is significant. This is also the reason why both systems typically exist side-by-side: whilst the modern IT database serves IT people, the historian suits the OT crowd.
Traditional IT databases discourage OT people from working with the data
Let’s take a look at a typical workflow of an OT engineer working with the United Manufacturing Hub right now:
- Background: You are an engineer in operational technology. You can do some programming and might have already executed a couple of SQL statements to work with databases. Your background lies within the areas of industrial electronics or PLC programming. You are mainly responsible for maintaining the existing equipment and help with the integration of new machines, production assets and systems that correlate with the daily doing on the shopfloor.
- What you did so far: You are now responsible for connecting machines and setting up a UNS (Unified Namespace). You were able to quickly install the United Manufacturing Hub and used Node-RED to extract data from your Siemens PLCs and sensor connect to retrofit additional IO-link sensors. You see the real-time data in MQTT Explorer and Kowl for Apache Kafka. You already built a little OEE dashboard containing shopfloor losses like availability, performance or quality losses.
- Your problem: You want to see your data. But where is it? Yeah, you could select it in Grafana (see also image), but this is not convenient. You want to work with it, such as by comparing multiple process values, downsampling them, calculating the mean, backfilling historical missing data, etc.

The intuitive and sub-optimal solution: providing direct access to the database
What we as the United Manufacturing Hub tried first, was giving the OT engineer access to the database behind it by allowing them to use Grafana to build their SQL queries. Using TimescaleDB’s functions it allows calculating the max, min, avg, etc., group them and combine them with other data streams.
For an IT professional, interacting with TimescaleDB is very simple. However, for someone who has hardly worked with relational databases, it is quite complex.
This becomes even more tricky when you are sat between two machines and just want to see some historical temperature values to better understand the last breakdown. If, on top of all this, the database doesn't have a user interface, you have to resort to tools like pgAdmin. This a pain and poses additional challenges because such tools require some knowledge of relational databases and their best practices, such as database normalization.
But what about Grafana?
Example: TimescaleDB and Grafana
Let's take a look at the PostgreSQL datasource for Grafana:
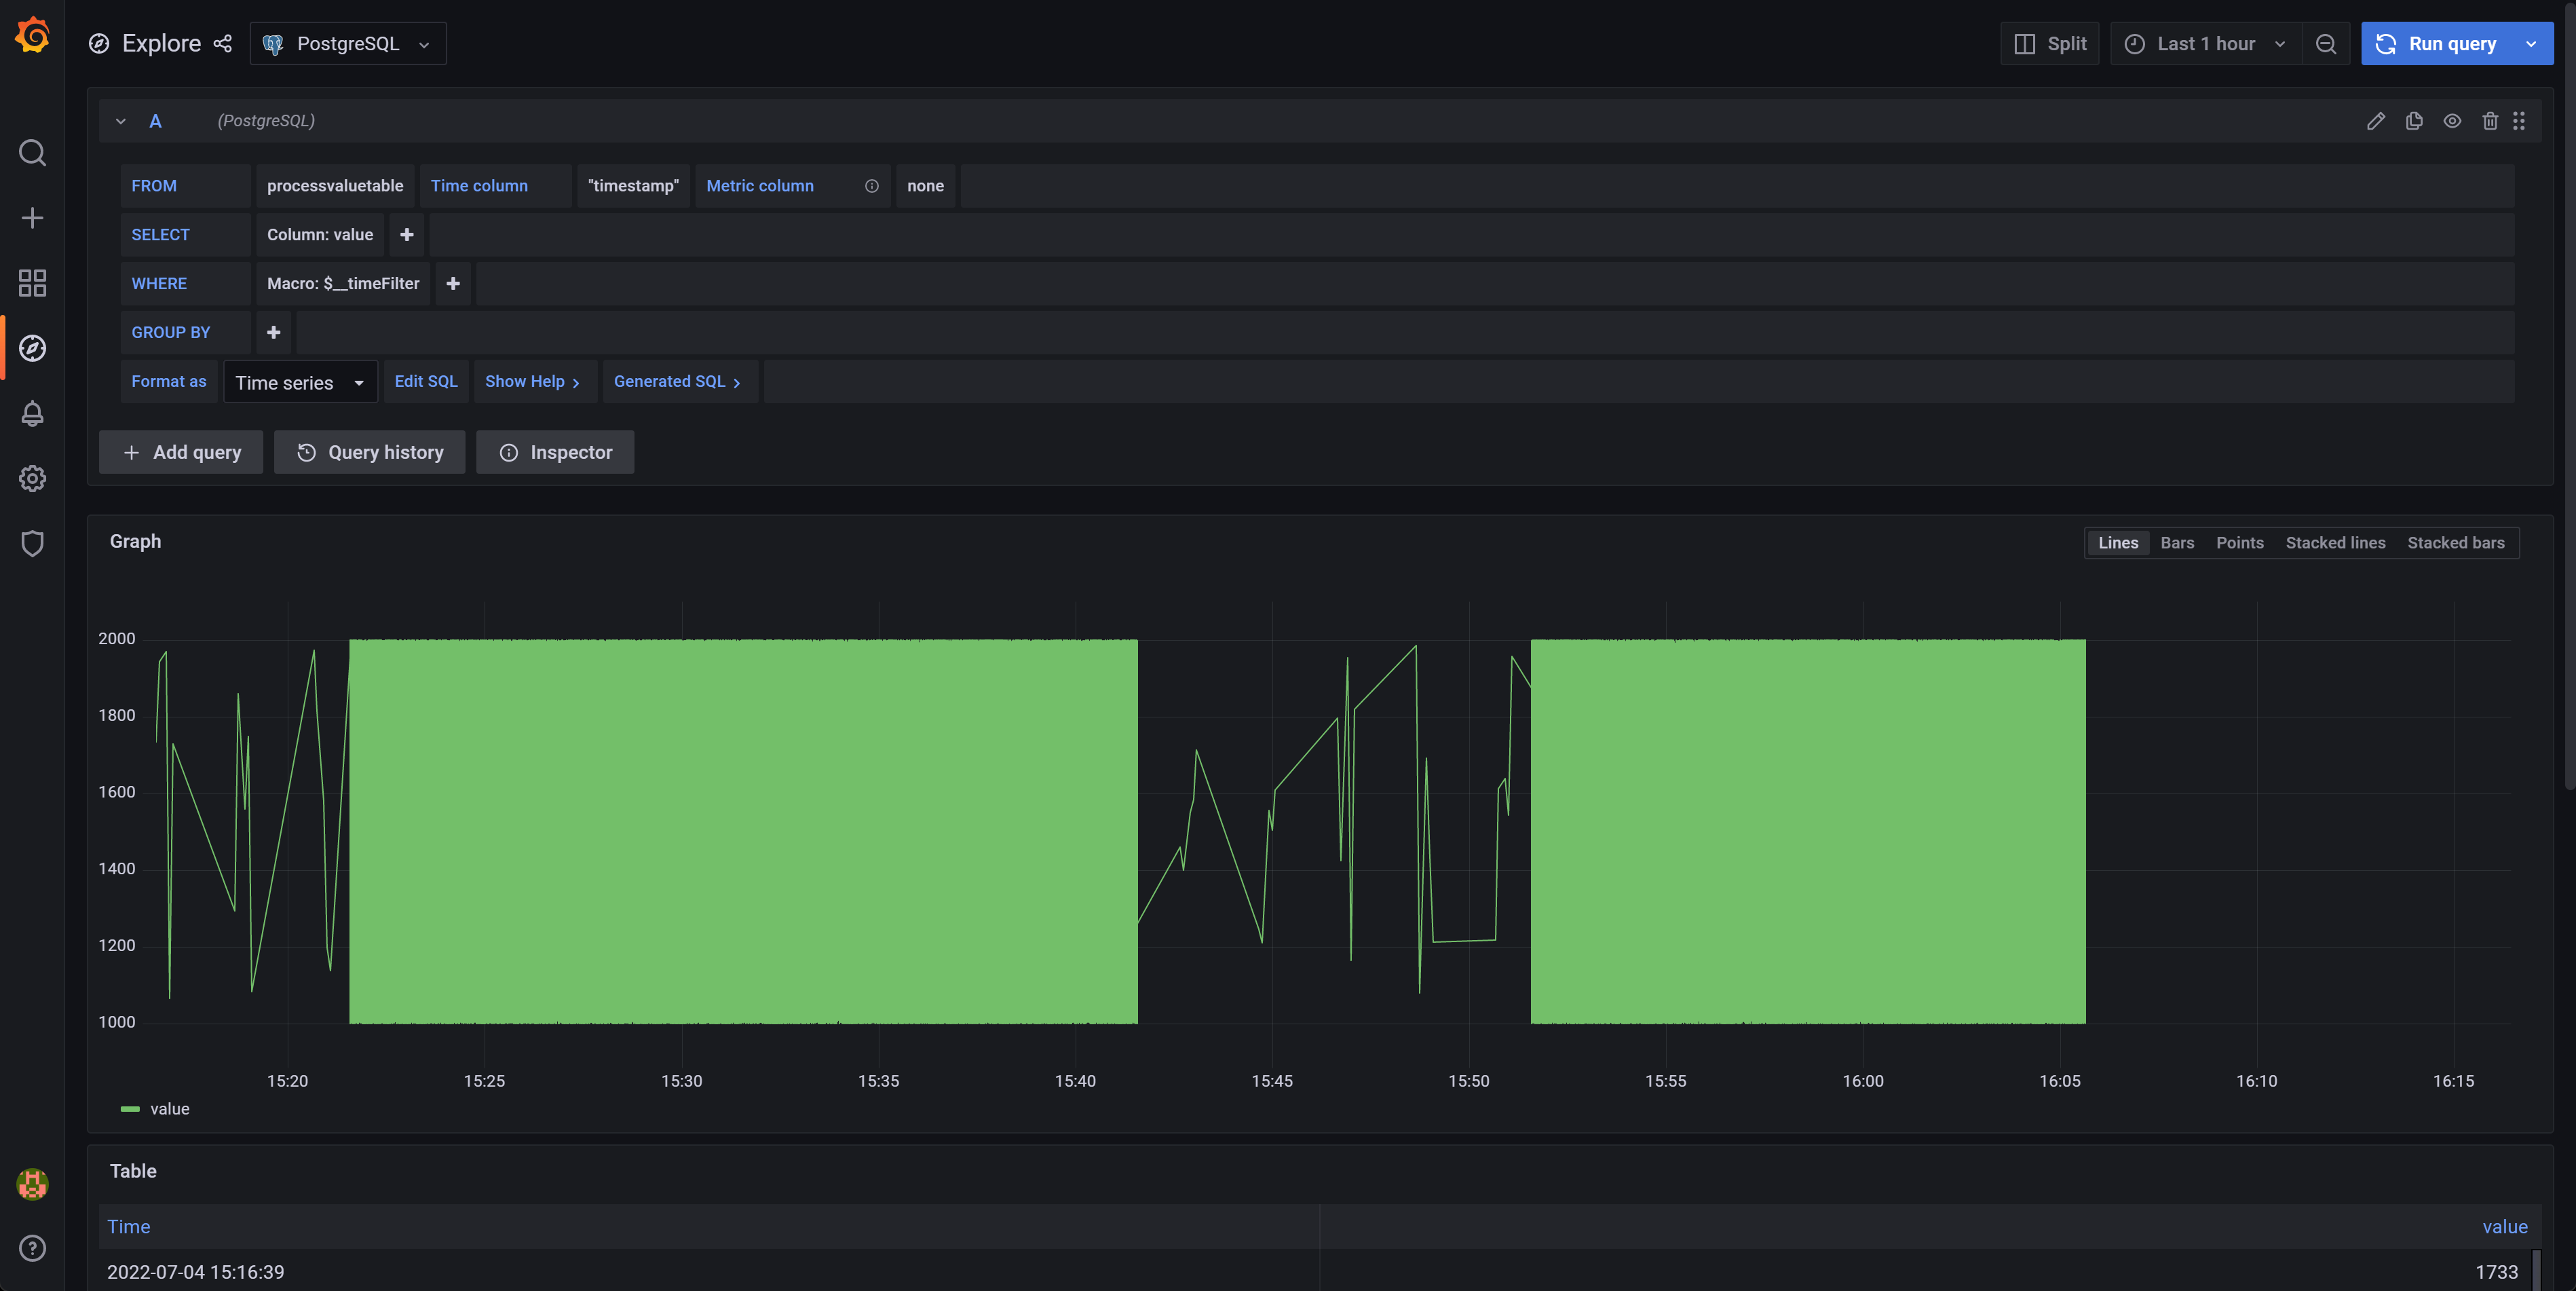
This is the initial look after loading it. The graph is mumbled together in a green “value”. Getting some historical data to understand the last breakdown is quite difficult.
With the help of way too many clicks (incl. finding the correct primary key for the asset, setting timestamp as the time column and valuename as metric column) , one finally manages to create a dashboard like the following:
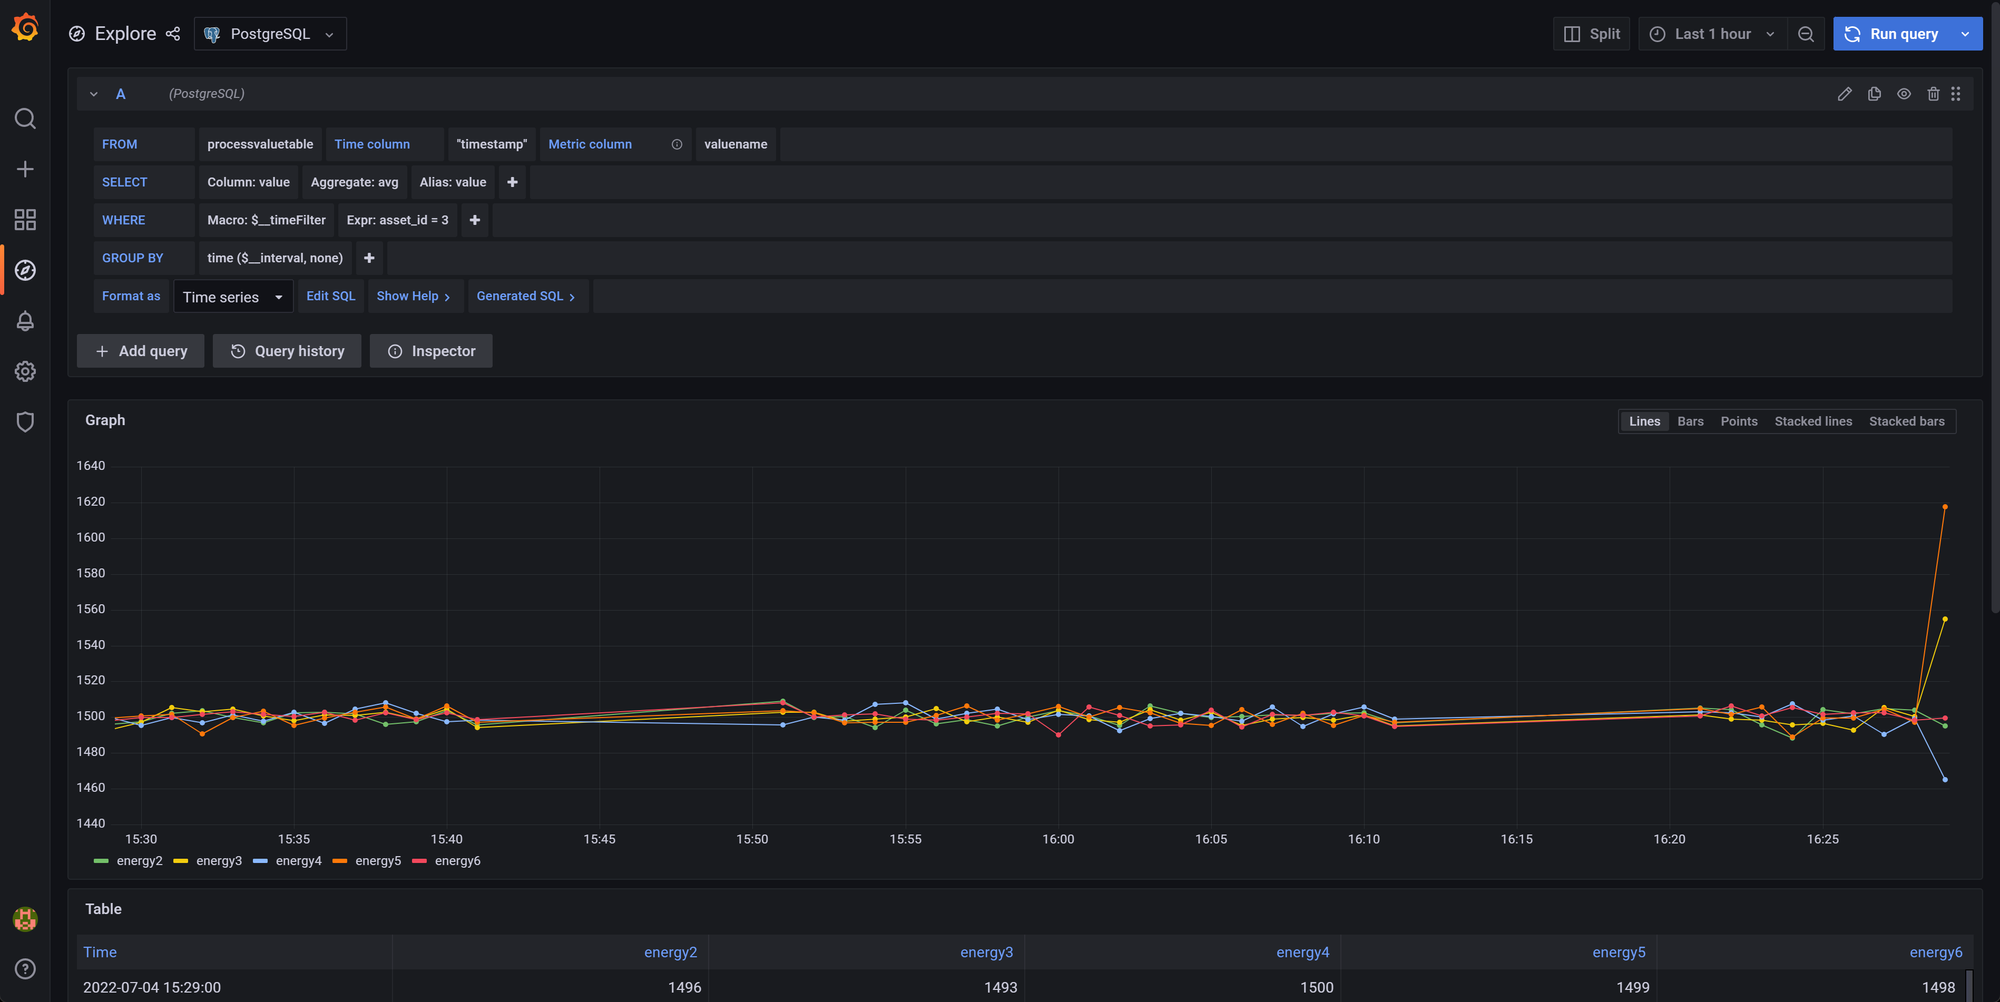
At the United Manufacturing Hub we are quite accustomed to Grafana. I'm one of the main developers here, and despite this, it took me about 45 seconds to get this view after opening Grafana! Things didn't go much better for my colleague Alex. Quite the opposite, even with a step-by-step guide it took him a few minutes to replicate it.
No OT engineer is going to do that while sitting in the dirt between two machines and getting yelled at by some managers because the machine isn't running.
We looked over the shoulders of many of our customers and saw that most of them were running InfluxDB or a Historian in parallel. Not to build any IIoT application, but just to "see" their own data.
Historians
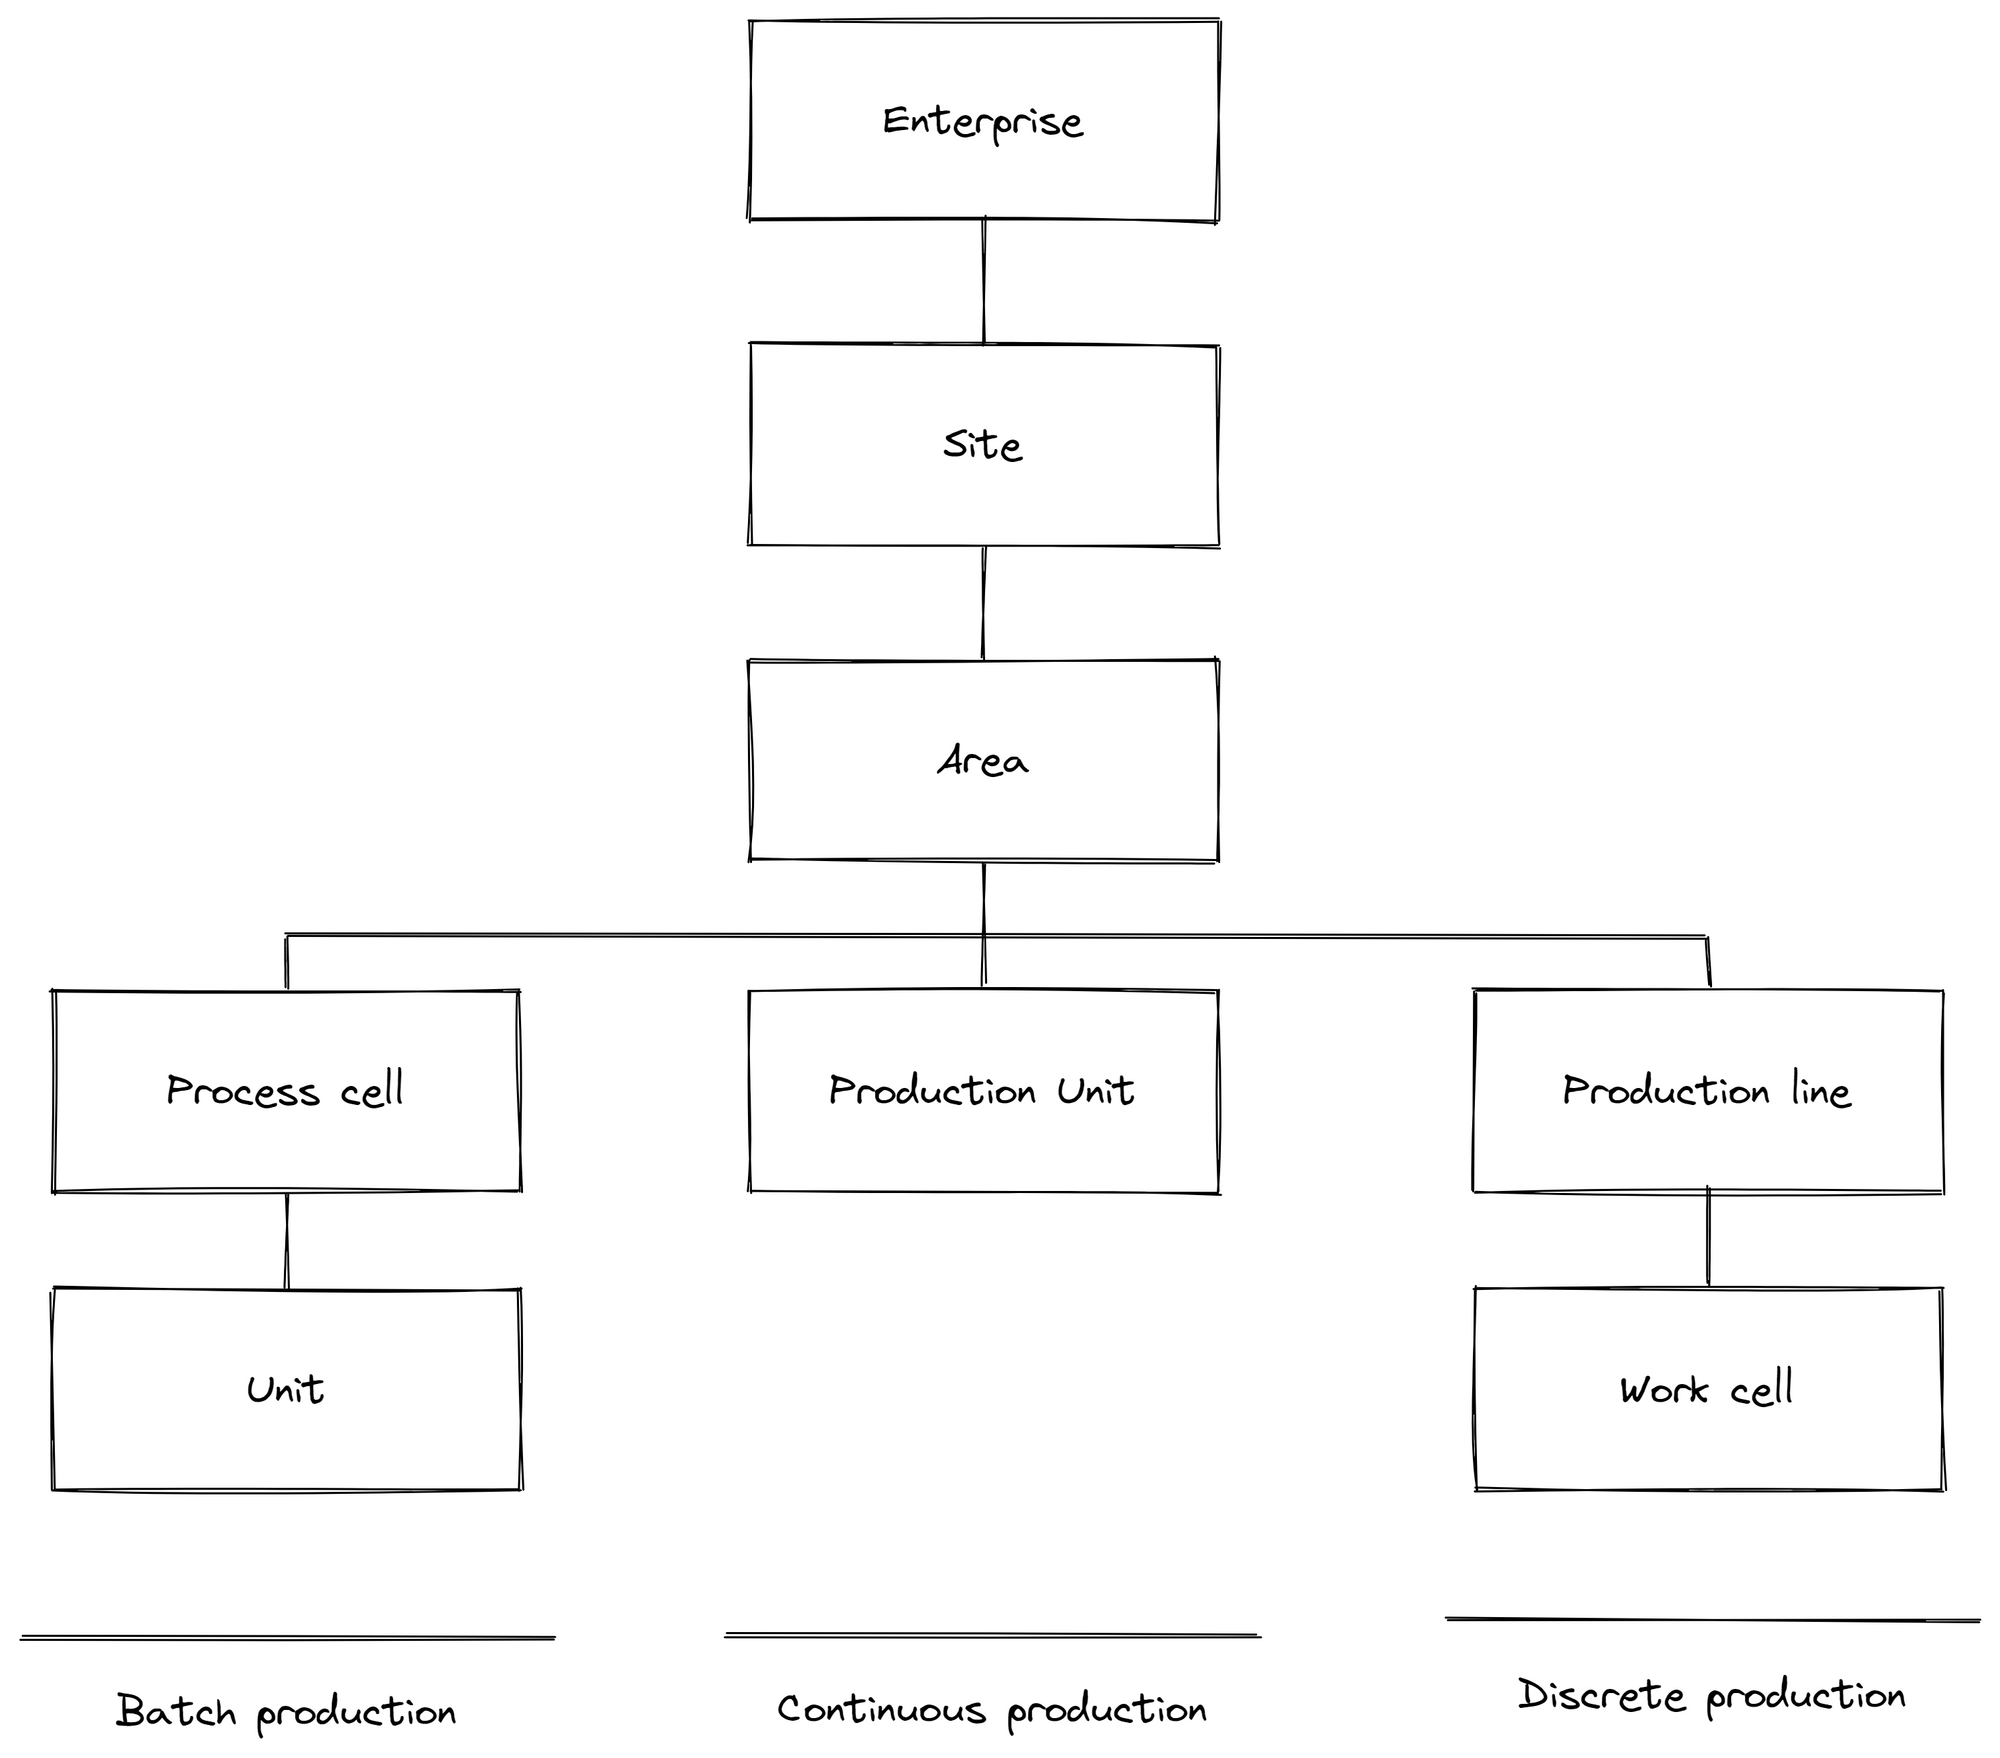
An OT engineer just wants to see his asset and their historical data in a ISA95 / IEC-62264 compliant model (enterprise --> site --> area --> production line --> work cell --> equipment --> PLC ---> tag).
And it has to be fast and error free.
The above approach with Grafana is neither fast nor error-proof. The technician can very easily "crash" the database by performing a long-running SQL command without ever realizing that he has just selected 15 GB of data. The "crash" becomes apparent when the the command overloads the database and which then cannot keep up with storing new data, thereby risking complete or partial system failure depending on the maturity of the implementation.
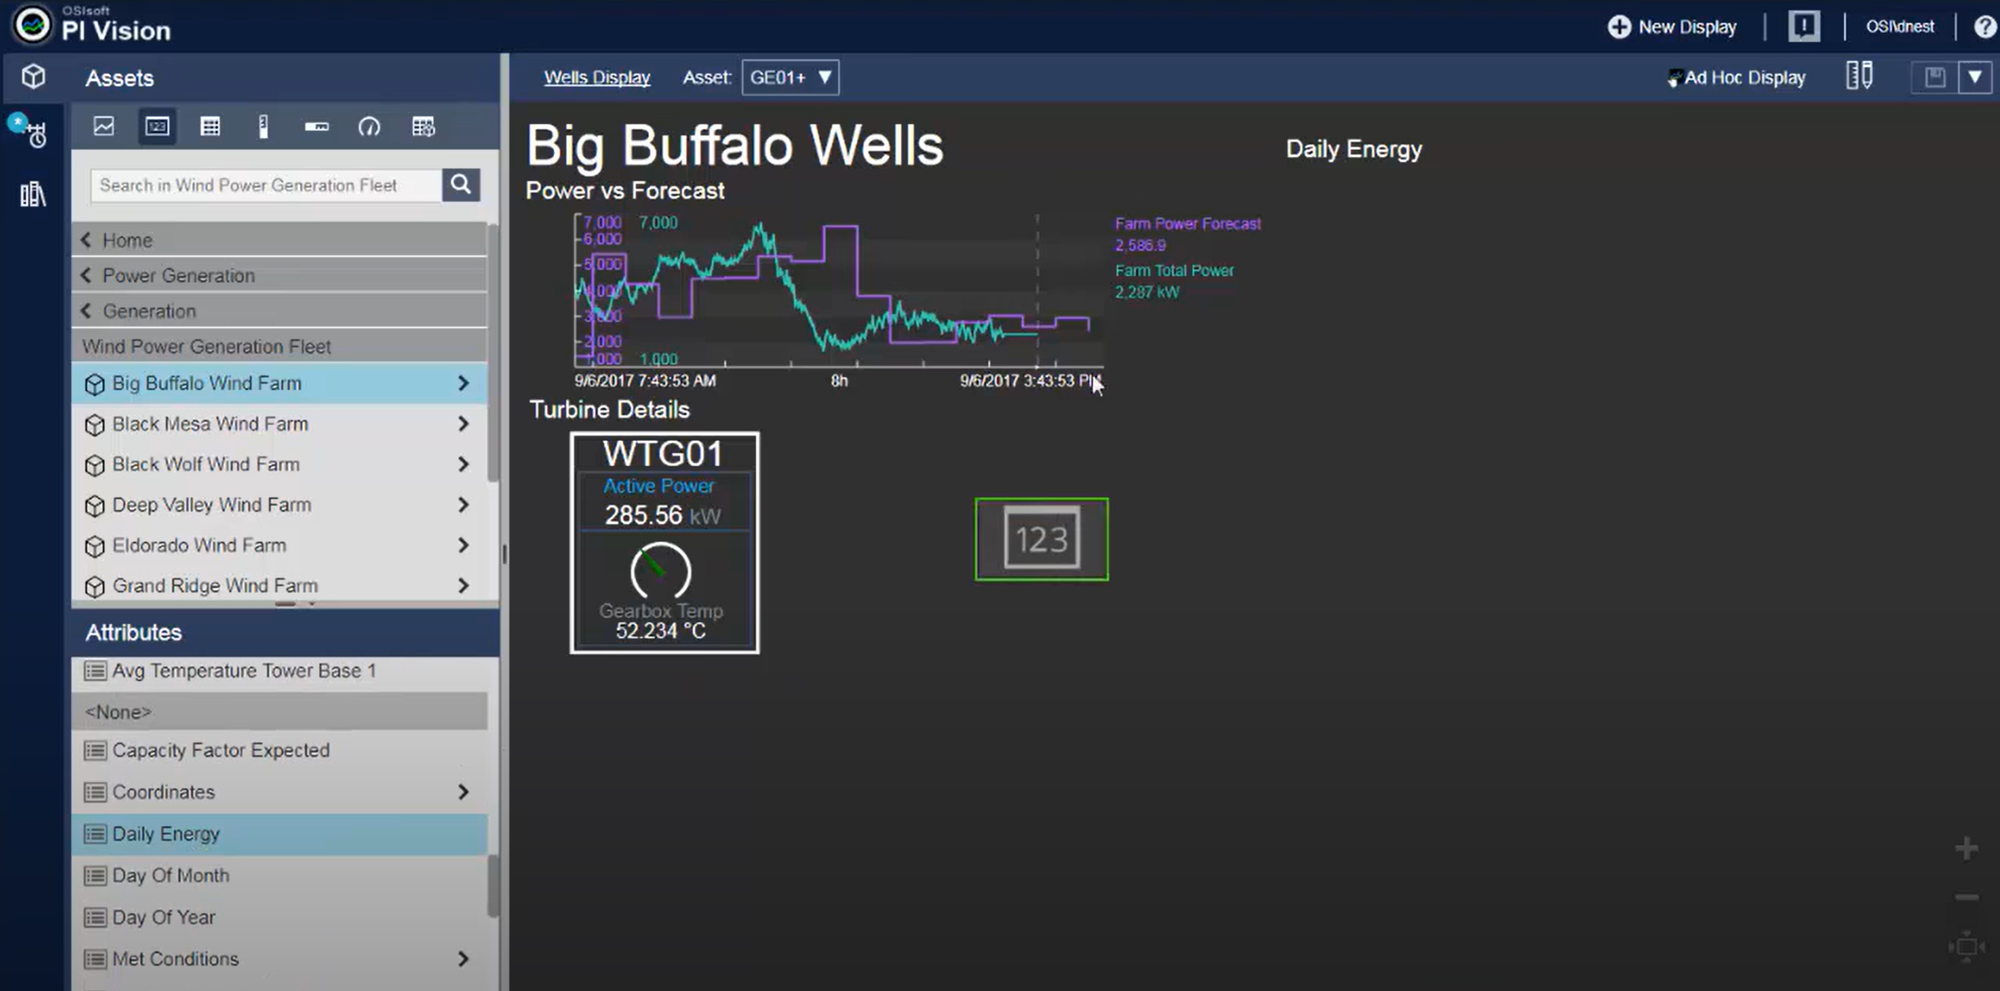
A historian helps the user out right here. It stores data and allows the OT engineer to query the data using their language and the models they know (without needing to worry about "crashing" / overloading the database) using drag-and-drop UIs. The OT engineer can now see his available data points including metadata (data quality, data types, etc.), work with the data, apply averages, perform combined queries, build continuous aggregates, etc.
Playing devil's advocate - three arguments against it
We can think of at least three arguments that might contradict the statement "Traditional IT databases keep OT staff from working with the data."
The first argument: "Hey, let's just ask the technician what kind of data he wants to see and what analysis he wants to do, and then we'll just prebuild it for him!".
The problem: A machine usually has a few hundred variables (also called "tags"), and it would be a waste of time to build all possible views. It's better to give the engineer a tool to do his own analysis.
Another argument could be "Grafana is bad, you have to use Microsoft PowerBI / PTC Thingworx / etc.".
But this approach also does not solve the fundamental problem that the technician has when interacting with the database. The technician still needs to understand a normalized database, perform joins, and optimize his queries.
A third argument might be, "But what about InfluxDB?"
Yes, InfluxDB is indeed an IT database that is well suited for use by OT technicians. It has an excellent visualization that exactly fits the workflow an OT engineer runs when he "wants to see some data". In addition, the data structure provided by InfluxDB makes an ISA95 compliant data model quite easy. Both points ease the initial friction that an OT engineer might have when working with an IT databases.
We tested the workflow described above with our COO Alex and one of our engineers Anton, and both were able to quickly explore their "tags".
However, as soon as it came to more complicated queries, such as performing a calculation for two tags, they were immediately lost.
And almost a year after our first article on InfluxDB, when we take another look, we still come to the same conclusion: reliability, scalability, and the ability to store relational data are more important than a fancy UI, especially in a field where data storage is often required from a legal perspective.
So we need something else here. What about Historians then?
Why are we even having this discussion if historians are clearly better than IT databases?
Because they aren't.
Even though OT engineers can work with them (some love them, some hate them), they are quite difficult for IT people to use and understand. Let's take a look at a typical workflow of an IT person working with a historian:
- Background: You are an Data Engineer in a larger company with multiple offices. Your job is to fill the "black hole" of production across the supply chain and apply a few machine learning algorithms. You've done a lot of work with cloud providers like Azure and AWS, and have been involved in some big data projects with Apache Spark and Kafka.
- What you've done so far: You've gotten Excel sheets and .csv exports from each factory's OT department and figured out that, in theory, all the data is available. Machine learning algorithms also work in proof-of-concept scenarios.
- Your problem: Now your task is to implement stream processing algorithms and integrate them with the rest of your company's IT, which relies heavily on Azure. However, there is no access to the database except for some strange APIs and connectors, of which the REST API seems to be the best way.
The intuitive and suboptimal solution: extracting data from Historian
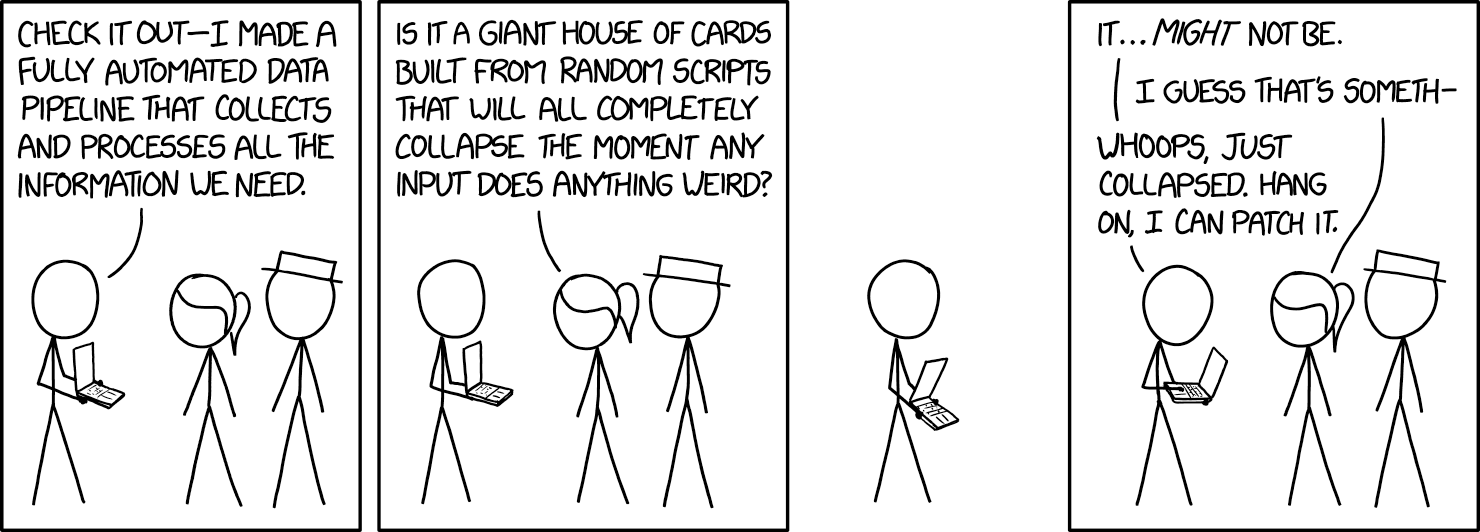
So you decide to write a service that continuously queries the REST API and feeds the data into your organization's data processing pipeline, where it is processed and then stored in a repository like S3 Glacier. However, you miss out on the real-time data and end up with duplicate data - once it's Historian and in then now it's in the cloud.
So for the data engineer, the data is lost as soon as it flows into a traditional historian.
Alternative solution: Unified Namespace
But there is another way, whilst suboptimal, it's doable. And that is rebuilding the entire infrastructure and setting up a central message broker between the PLCs and the Historian. This concept is also known as Unified Namespace (which can be seen as an extended event-driven architecture).
This would allow the data engineer to access real-time data and feed it into his organization's data processing pipeline, while the data could also go into the Historian to be used by the OT engineer.
However, data would still be duplicated between cloud and historian.
Playing devil's advocate - there are modern historians out there
"But there are modern historians out there! They have good integration with outside systems!"
Fair points. We've looked at a couple of them.
First, there is Ignition. Ignition is marketed as as including historian functionality. However, a look at the documentation reveals that it requires an additional SQL database in the backend. Options include TimescaleDB. So Ignition combines best practice IT databases with ease of use for an OT engineer. This could be a good choice for companies willing to use a proprietary platform as their central infrastructure.
Then there is Canary. Canary says it is a NoSQL data historian developed in 1985 with over 19,000 installations (2022-08-04). According to the website, it provides support for MQTT, which greatly facilitates integration with a unified namespace and event-driven architecture.
However, there is very little freely available documentation on the IT side, which significantly reduces acceptance by IT engineers. We could not find any information on ACID compliance, CAP theorem or consistency by searching their website using Google or their internal search function. We additionally found that it requires Windows and the Windows Registry (which might make integration with modern Linux / Cloud based architectures quite difficult, see also next chapter).
Canary's main argument against IT time-series databases like InfluxDB and TimescaleDB is, that they are VC backed, which might result in a loss of support, product quality and user satisfaction. In our opinion, this argument is pretty weak as there are a lot of successful, VC backed companies, for example the companies behind Docker, Terraform or elasticsearch.
What we really liked is the publicly available pricing that they have and that they are much cheaper than OSIsoft PI.
Typical historians are incompatible with the modern cloud-based landscape
But the data engineer is not the only IT person who works with the Historian: There are also the sysadmins / DevOps who make sure Historian stays up and running. And for them, it's just a weird black box running on a virtual machine.
Historians have a fundamentally different approach to the topics of reliability, scalability and maintainability than modern IT systems.
(By the way, I took the following definitions from one of my favorite books "Designing data-intensive applications" by Martin Kleppmann.)
Reliability is defined as the ability of a system to continue to work correctly even when hardware & software faults and human errors occur. Scalability is defined as the ability of a system to deal with increased load.
The biggest point here is that there is not much publicly available information on Canary and OSIsoft PI on how these two topics are handled exactly. The lack of information makes decision-making much more difficult, which in particular complicates internal company discussions between IT and OT. Both OSIsoft PI and Canary mention the topic of replication, but do not explain, for example, as with Canary, how it is ensured here that no inconsistencies occur between the instances.
Consequently, all the major IT databases explain in minute detail how they handle these issues. Here are a few examples:
- TimescaleDB: scalability (replication and partitioning) and reliability (ACID compliance, etc.)
- Elasticsearch: scalability, and reliability
- SQLite: scalability (it is not scalable and they clearly state that), and reliability
Maintainability is defined as the ability of a system to be productively used (adapt, changed, expanded, etc.) by multiple people over the lifetime of the system. In this article, we will focus on two operability issues as examples:
First, there are no monitoring / logging features like Health Check or metrics endpoints either, so the Historian can be maintained by the enterprise operations teams using their tools like Prometheus or PagerDuty. They have to rely on calls from OT engineers when something is not working. This has a direct negative impact on "time to resolution."
Second, historians are usually deployed manually on-premises on a single Windows VM (virtual machine). This was also the common approach for a long time before Docker and Kubernetes came along (around 2014). Today, more and more workloads are automatically deployed and provisioned in the cloud as a containerized application. Advantages are better scalability on the cost of an easier setup (see also monolithic vs microservice architecture). A single Windows VM feels like an outsider here.
Historians have also recognized this and, for example, Canary is currently developing a containerized Linux version as well (source: Canary's Jeff Knepper).
In summary, deploying and running a traditional historian as they are today will likely cause friction with the companies IT department trying to modernize their IT landscape.
How we handle the situation
The ideal solution would be a system, that is fulfills the requirements of the OT engineer, but is still maintainable by IT.
For a system to be maintainable by IT, it needs to be built upon IT best-practices like for example well-established and ACID compliant databases, open-source (it does not need to be, but it is surely a huge important factor) and good integration into other IT systems like monitoring and logging.
For a system to be usable by the OT engineer, it needs to speak the same language (ISA95, etc.) and must have feature parity like easy querying, alerting, and exploring the data.
Right now, the United Manufacturing Hub in combination with TimescaleDB has theoretically all required features from IT and OT:
- Reliable, scalable and maintainable time-series storage using TimescaleDB
- Connectors to various data sources on the shop floor using Node-RED
- Unified Namespace for real-time data access incl. MQTT and Apache Kafka
- Various stream processing logics and alerting using Node-RED and benthos (in development)
But the United Manufacturing Hub lacks right now a user-friendly story for the OT engineer. And this is what we've been working on the last couple of weeks!
We are adjusting the data model to be ISA95 compliant, significantly re-working the UI, adding time-series functions (gap filling, down sampling, min/max/avg/etc.) and integrating it with Grafana Alerting.
This would result in the United Manufacturing Hub being an Open-Source Data Historian with strong support for the IT world!
Interested in a sneak-preview? Join our Discord!
Summary and outlook
Traditional IT databases discourage OT engineers, and traditional OT historians discourage IT engineers.
There are several approaches to mitigate this problem: Ignition, which provides an OT user interface on top of an IT database, and Clarify, a SaaS offering for storing and visualizing your time series data.
Our approach, as of now the only open-source approach we know of: we are currently extending the United Manufacturing Hub so that it can be used by an OT engineer and maintained by an IT engineer. We accomplish this by using robust IT best practices at the core with an OT-friendly user interface.
We hope that this will help us bridge the gap between IT and OT and continue to roll out the United Manufacturing Hub globally.
Contributors
Many thanks also to the following people who gave me valuable feedback for this article:
- Rick Bullotta, former Co-Founder / CTO ThingWorx
- Marc Jäckle, Technical Head of IoT at MaibornWolff
- Carl Gould, Co-creator of Ignition
- James Sewell, Principal Developer Advocate at TimescaleDB
Our Discord community is the place for you. With over 400 members, we offer a platform for practical, technical dialogue.
For direct inquiries, feel free to contact us.


