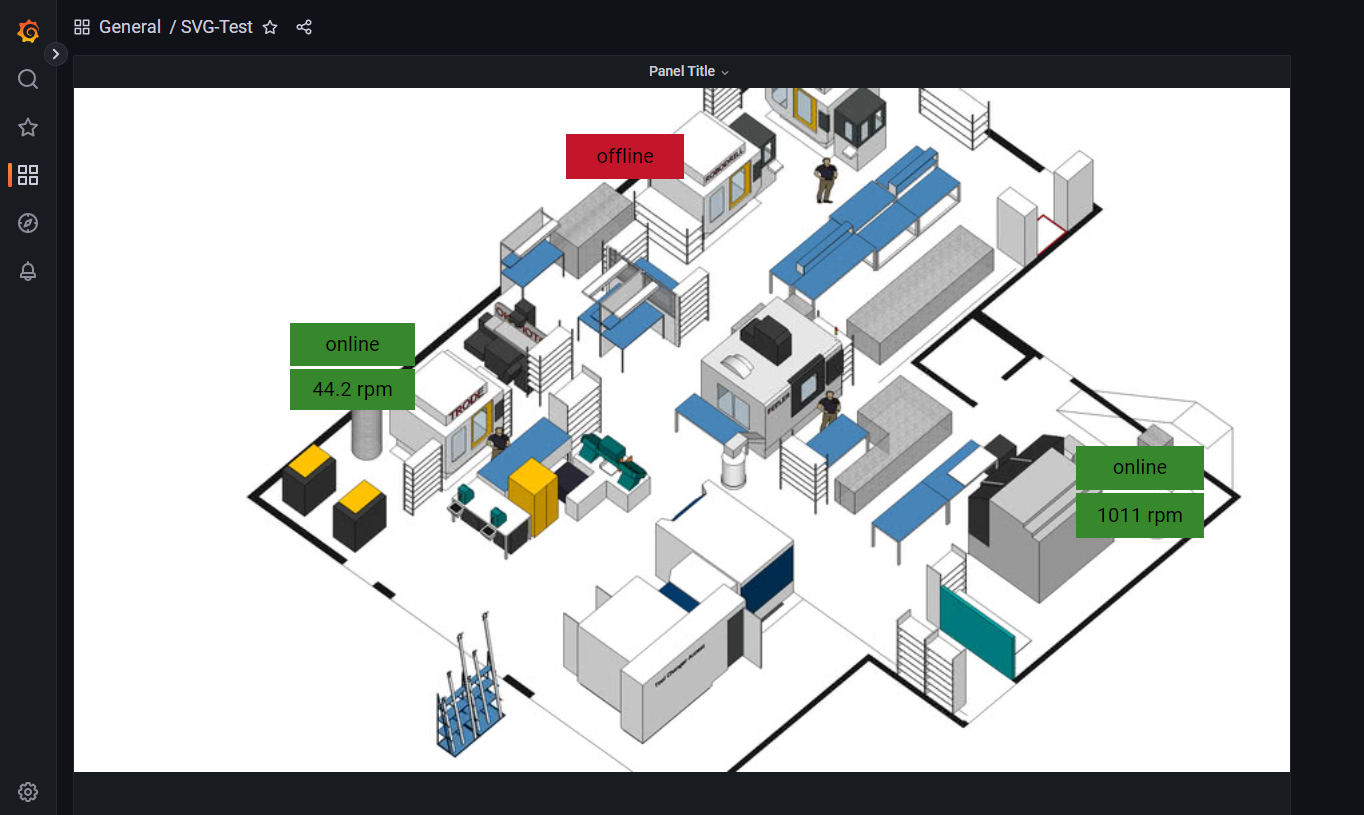
Grafana Canvas is a new exciting plugin for Grafana that allows users to design custom visualizations and overlay data on top of images within Grafana's user interface. With its ability to create "shopfloor dashboards", like the one shown in the example image, Canvas be a more intuitive way to display data than the standard grafana dashboard. It is enabled by default in newer versions of the United Manufacturing Hub, giving users easy access to try it themselves.

Why should you use Canvas?
Canvas offers new possibilities that standard panels lack, making it a fun tool for experimenting with different data visualizations. The panel provides the familiar interface of Grafana, allowing users to create image layers, overlay text/values updated by UMH data sources, and display icons that can change color based on their current condition. This feature enables the creation of visually rich and interactive visualizations tailored to specific needs.
An example of utilizing Canvas is creating a shop floor visualization that features a detailed map of the shop floor as the background. By overlaying real-time data from various machines and equipment on top of this map, users are able to quickly make data-driven decisions by having a clear view of the status of every machine at a glance. This fills the gap in traditional Grafana dashboards, which can sometimes get a bit crowded.

Conclusion
Grafana Canvas is a powerful tool for creating custom, interactive and visually engaging visualizations. Furthermore, with its new possibilities and capabilities, Canvas could be a look into the future of data visualization and with its active development, we can expect new features and improvements to come.
To learn more about Grafana Canvas and how to create a shopfloor dashboard, check out our tutorial, which provides step-by-step instructions on how to create such a dashboard. For any questions, feel free to contact us or join our Discord.


