


In this guide you will learn the basics of data contextualisation with Node-RED. You will learn how to process sensor data, in this case simulated data, and how to process it to fit the United Manufacturing Hub data model.
Before you start, take a look at our data model by checking out the documentation. In short, any data type, e.g. a shift, sensor data or other acquired data can be formatted into the UMH data model. Why is this important? First, it is important to structure the data to keep track of it. Secondly, the UMH can automatically calculate KPIS and OEE if you follow the data model.
Prerequisites
- Node-RED opened in your browser
- node-red-contrib-kafkajs plugin installed.
Instructions
-
Drag the following nodes into your Node-RED flow:

-
Open the kafka consumer node
-
Create a new client by clicking on the pen.
-
Give the client a Name, configure the Brokers field with
united-manufacturing-hub-kafka:9092and choose a unique Client ID.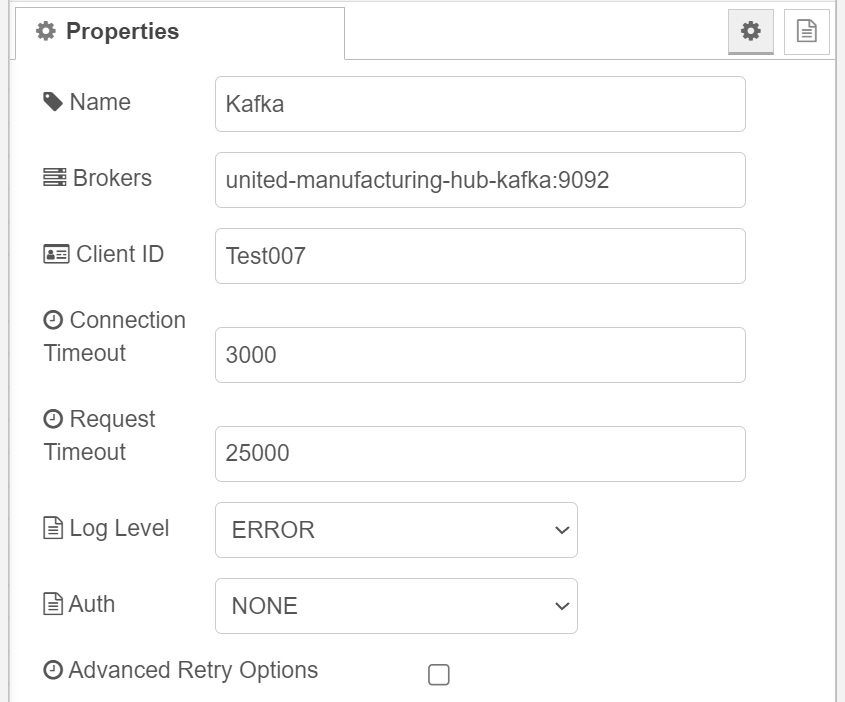
-
Click on the top right on Update.
-
Configure the Name and Group ID field with a fitting name and enter in the Topic field
ia.raw.development.ioTSensors.Temperature. Finally click Done.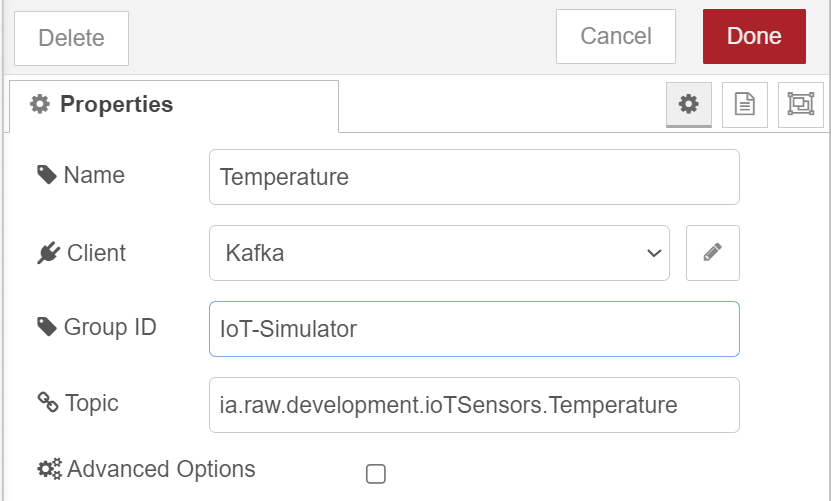
-
Open the function node and paste in the follwing:
msg.payload = { "timestamp_ms": Date.now(), "Temperature": parseFloat(JSON.parse(msg.payload)["value"]) } return msg; -
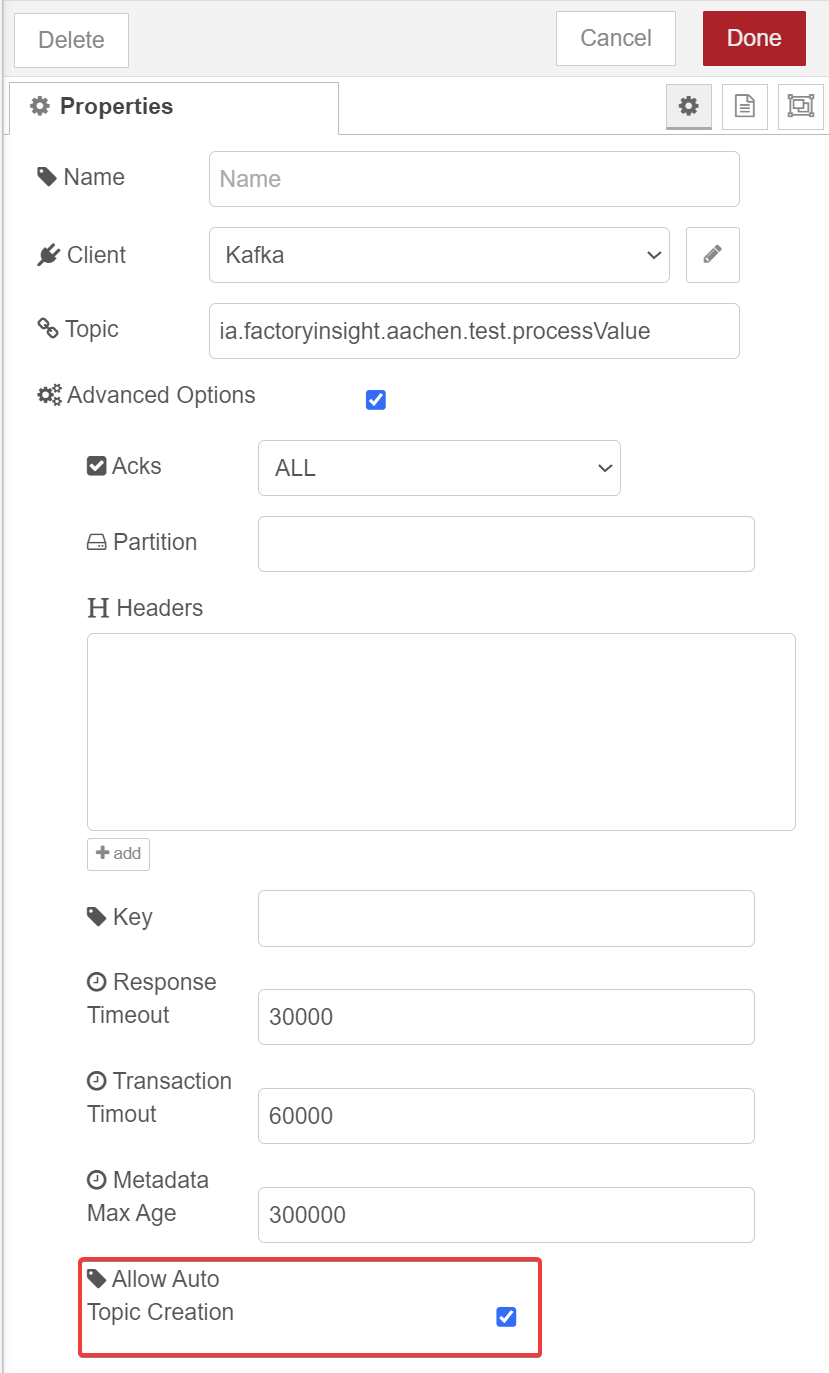
Next, open the kafka producer node and select your previously created client.
-
Configure the Topic field with
ia.factoryinsight.aachen.test.processValueand tick Advanced Options. -
Tick the box Allow Auto Topic Creation and click on Done.
12. Finally click on Deploy located on the top right.
13. Now your flow is active and you have successfuly contextualized the temperature data.


