Embarking on the journey to design an efficient IT/OT infrastructure can be a daunting task, given its complexity and the multitude of services and tools involved. Over the last six years, we, the team UMH Systems, have ventured through this labyrinth, navigating the intricacies to design a reliable reference architecture. Through trial and error, articles, and tutorials, we have learned invaluable lessons from both our experiences and the industry's thought leaders.
And it is not only us talking about the change in IT and OT infrastructure:
- There's the concept of the MING stack consisting of Mosquitto, InfluxDB, Node-RED and Grafana.
- The combination of MQTT and Kafka is so popular, that HiveMQ is not only writing a lot of blog articles about it, but the Kafka Connector of HiveMQ is also their most sold enterprise plug-in.
- The guys from Kafka are writing a lot about IT and OT, for example on Kai Waehners blog.
- Marc Jäckle and Sebastian Wöhrle from MaibornWolff created their "One Size Fits All" architecture for industrial IoT platforms.
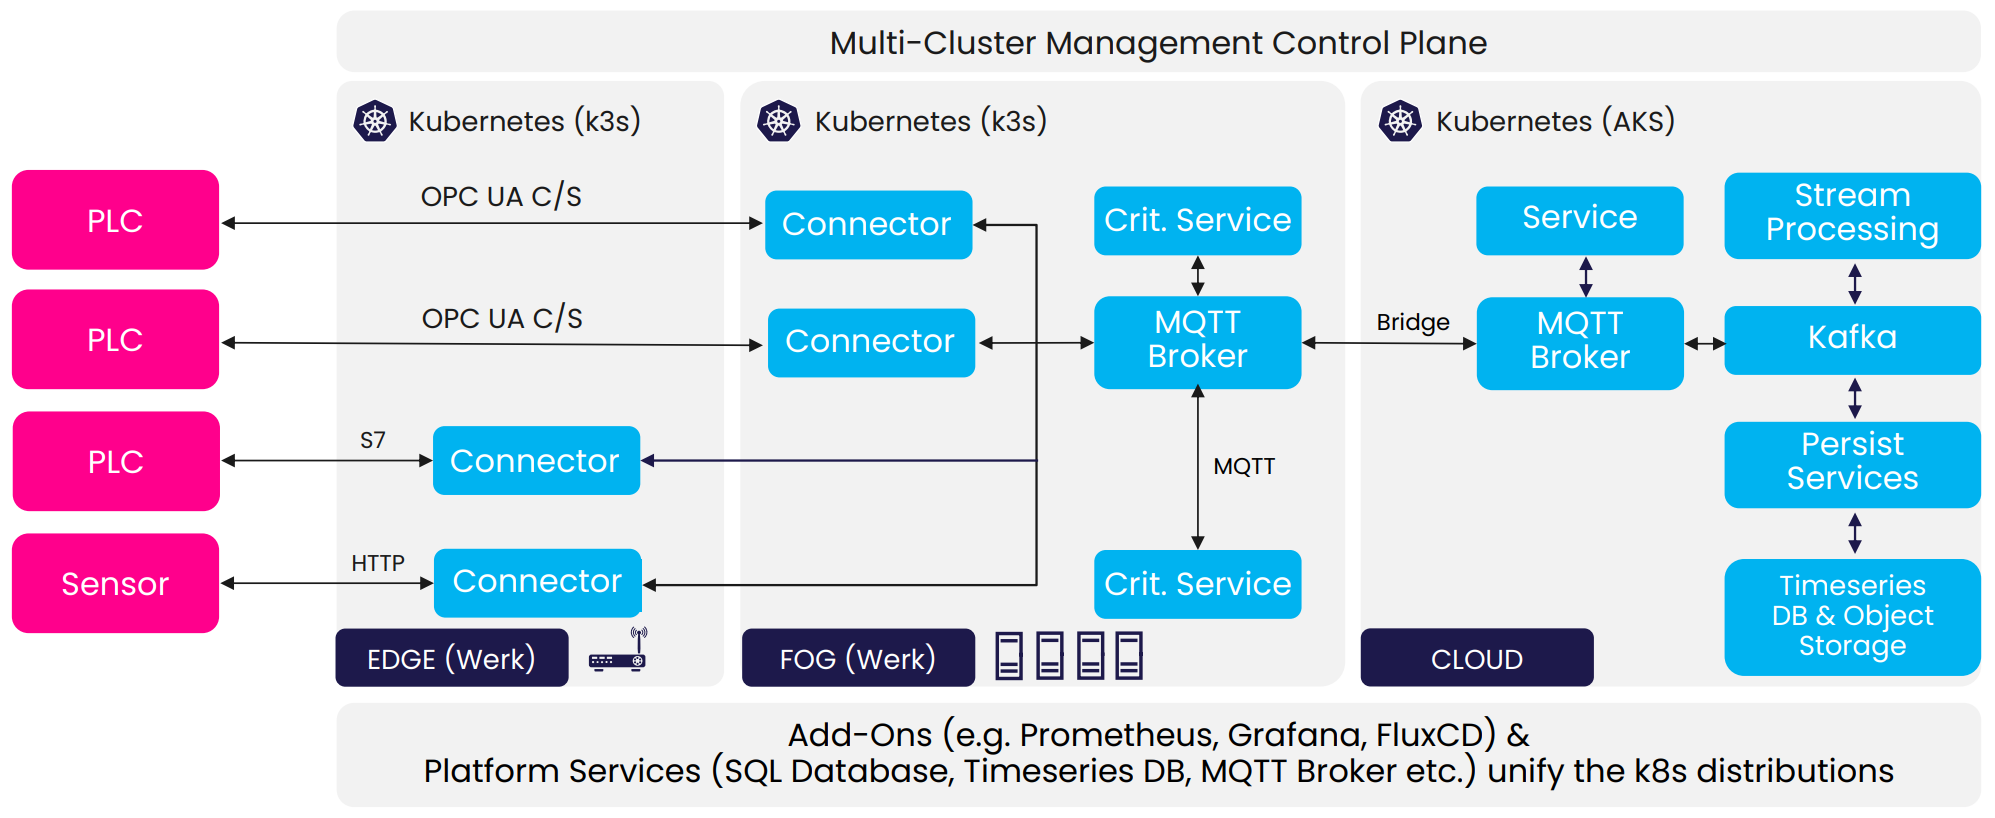
But why is setting up an IT/OT infrastructure such a complex task, that involves so many different services and tools? Why use not only MQTT but a combination of MQTT and Kafka? And why make the effort to utilize Kubernetes and a Helm Chart instead of Docker Compose? What is the reason I should invest in costly sensors and OT Hardware, instead of cheaper alternatives? We had to find out the hard way, why it is much more complicated, if you not use these architectures and tools.
This article aims to shed light on the challenges of designing an IT/OT infrastructure, unravel the reasons behind the choice of certain tools and services, and share the hard-learned lessons from our journey. We hope to guide you away from blunders we made and towards effective solutions.
2016-2017: The Challenge of Low-Code/No-Code Solutions
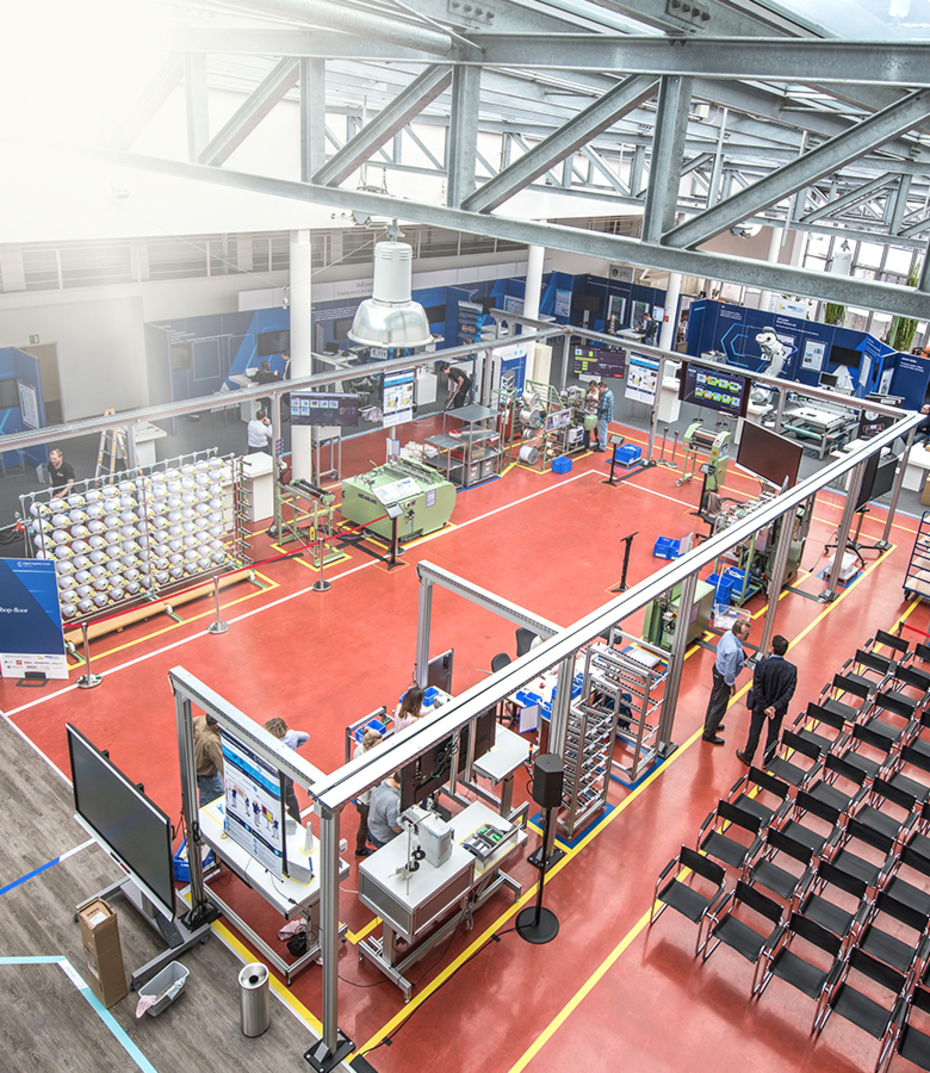
In 2016-2017, I, Jeremy Theocharis (now CTO and Co-Founder), was responsible for integrating various industry 4.0 solutions into the model factory at the Digital Capability Center Aachen. This model factory aimed to showcase as many solutions as possible. However, I encountered significant challenges in combining and scaling these solutions, which were rooted in the differences between Information Technology (IT) and Operational Technology (OT).
Pitfall 1: Treating IT and OT the Same Way
To achieve the desired integration of industrie 4.0 solutions, I had to combine several different tools from IT and OT. Initially, I assumed combining both would be straightforward given their presumed similarities, but I was mistaken.
Information Technology (IT) and Operational Technology (OT) are two distinct domains that seem to exist in separate worlds when taking a closer look. IT deals with networking, servers, virtual machines, and programming languages like C, C++, Java, Python, or Golang. In the IT domain, aspects such as quick development cycles (for example agile software development, continuous integration & delivery), scalability, and user experience are highly important, while reliability, safety, standards, and certifications are less crucial. This is because IT systems often have redundant hardware and highly available software, and consequences of hardware failures are typically smaller.
On the other hand, OT focuses on PLC programming, unique programming languages and protocols, electronics, and a slower pace of change. The OT domain places high importance on reliability, safety, standards, and certifications due to the potential for extreme damages to property and most importantly humans, the long lifespan of machines (20-30 years, sometimes 50+ years), and the legal requirements for safety and reliability. Aspects such as user experience, quick development cycles, and IT security are less important in the OT domain.
This fundamental difference between IT and OT made it challenging to find a way to integrate, combine and scale the various solutions into existing machinery and systems. Take, for instance, adding an internet connection to a machine. Usually, there are no pre-existing network cables. IT expects these cables, but OT isn't responsible for their installation, a task typically assigned to specialized electricians. Moreover, adding an IT switch to the machine's electrical cabinet isn't simple due to OT standards. OT components in the cabinet are mounted on standardized top hat rails and connected to a 24V power supply, specifications that IT hardware often doesn't meet. The moment software came into play, these differences nearly became insurmountable.
Pitfall 2: Misconception of Low-Code
Initially, I was optimistic about the availability of numerous tools advertised as easy-to-integrate, low-code solutions. However, these tools often failed to meet their advertised capabilities, as they were not as user-friendly or easy to integrate as promised. One common misconception was that low-code meant no-code. In reality, complex individual adjustments were still necessary, leading to many improvised solutions that required a significant amount of coding.
This reliance on low-code approaches also made it challenging to adhere to best practices, such as using Git for version control. These adjustments and restrictions made deployment, automation, and scaling over many instances incredibly difficult. Furthermore, the tools examined were not only insufficient and impractical but also expensive. In the end, specialized IT system integrators had to be hired to tailor the desired solutions. Despite their efforts, the solutions would often be more work-arounds than proper software based on best-practices, and high license costs persisted. This experience proved to be very frustrating.
2018: The Struggle with Embedded Systems and Hardware Challenges
In 2018, during multiple client studies for McKinsey, I retrofitted older machinery with new sensors to calculate the OEE of production lines.
Pitfall 3: Underestimating the Importance of OT Certifications
I tested an alternative to my previous solutions: low-cost, standardized gateways based on embedded systems that made it easy to connect sensors and access the gathered data for dashboard creation or other services. However, this hardware was not proper OT hardware and was often unsuitable for the harsh environments of production sites. For example, electromagnetic disturbances from a conveyor belt disrupted the gateways in one deployment. Moreover, troubleshooting without direct hardware access was nearly impossible due to the hardware's limitations.
It is not optimal to tell a customer in Japan to screw open the installed hardware, connect it to a laptop with a special cable and let it sit there, running TeamViewer, while the line is continuously running.
The gateways' vulnerabilities and troubleshooting requirements negated their acquisition cost and installation advantages compared to traditional PLCs.
Pitfall 4 (1/2): Challenges with a Cloud-First Approach
In my efforts to improve, I opted for a cloud-first approach, sending all data off-site for further processing. SaaS tools provided affordable, easy-to-use OEE dashboards. However, these tools faltered when it came to customization or integration, either being impossible or prohibitively expensive.
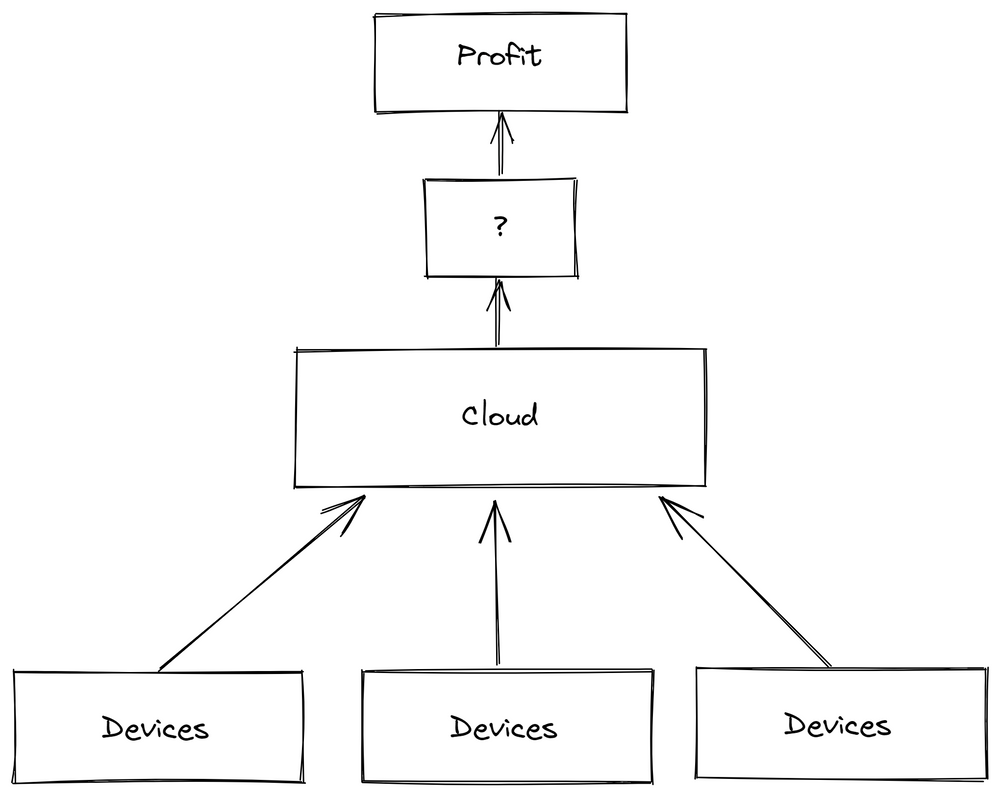
Network instabilities and access challenges in large factories emerged as significant problems. In one instance, production took place several floors below ground level, where a mobile data connection was unreliable at best. So I needed to install cellular data extenders, which are a mess from a technical and regulatory side.
2019 - Own Company, Own Hardware and MQTT
Driven by my frustrations I joined forces with two further collaborators and we founded our own company in 2019 to address the lack of simple and easy-to-deploy solutions.
Pitfall 5: Overestimating IT Competence of OT System Integrators
We created the first version of our FactoryCube, a small electrical cabinet built from standardized OT hardware, such as a PLC. It connected to an Azure VM in the cloud running Mosquitto, InfluxDB, Telegraf, and Grafana, allowing digital and analog sensor connections and data extraction with MQTT for further use.
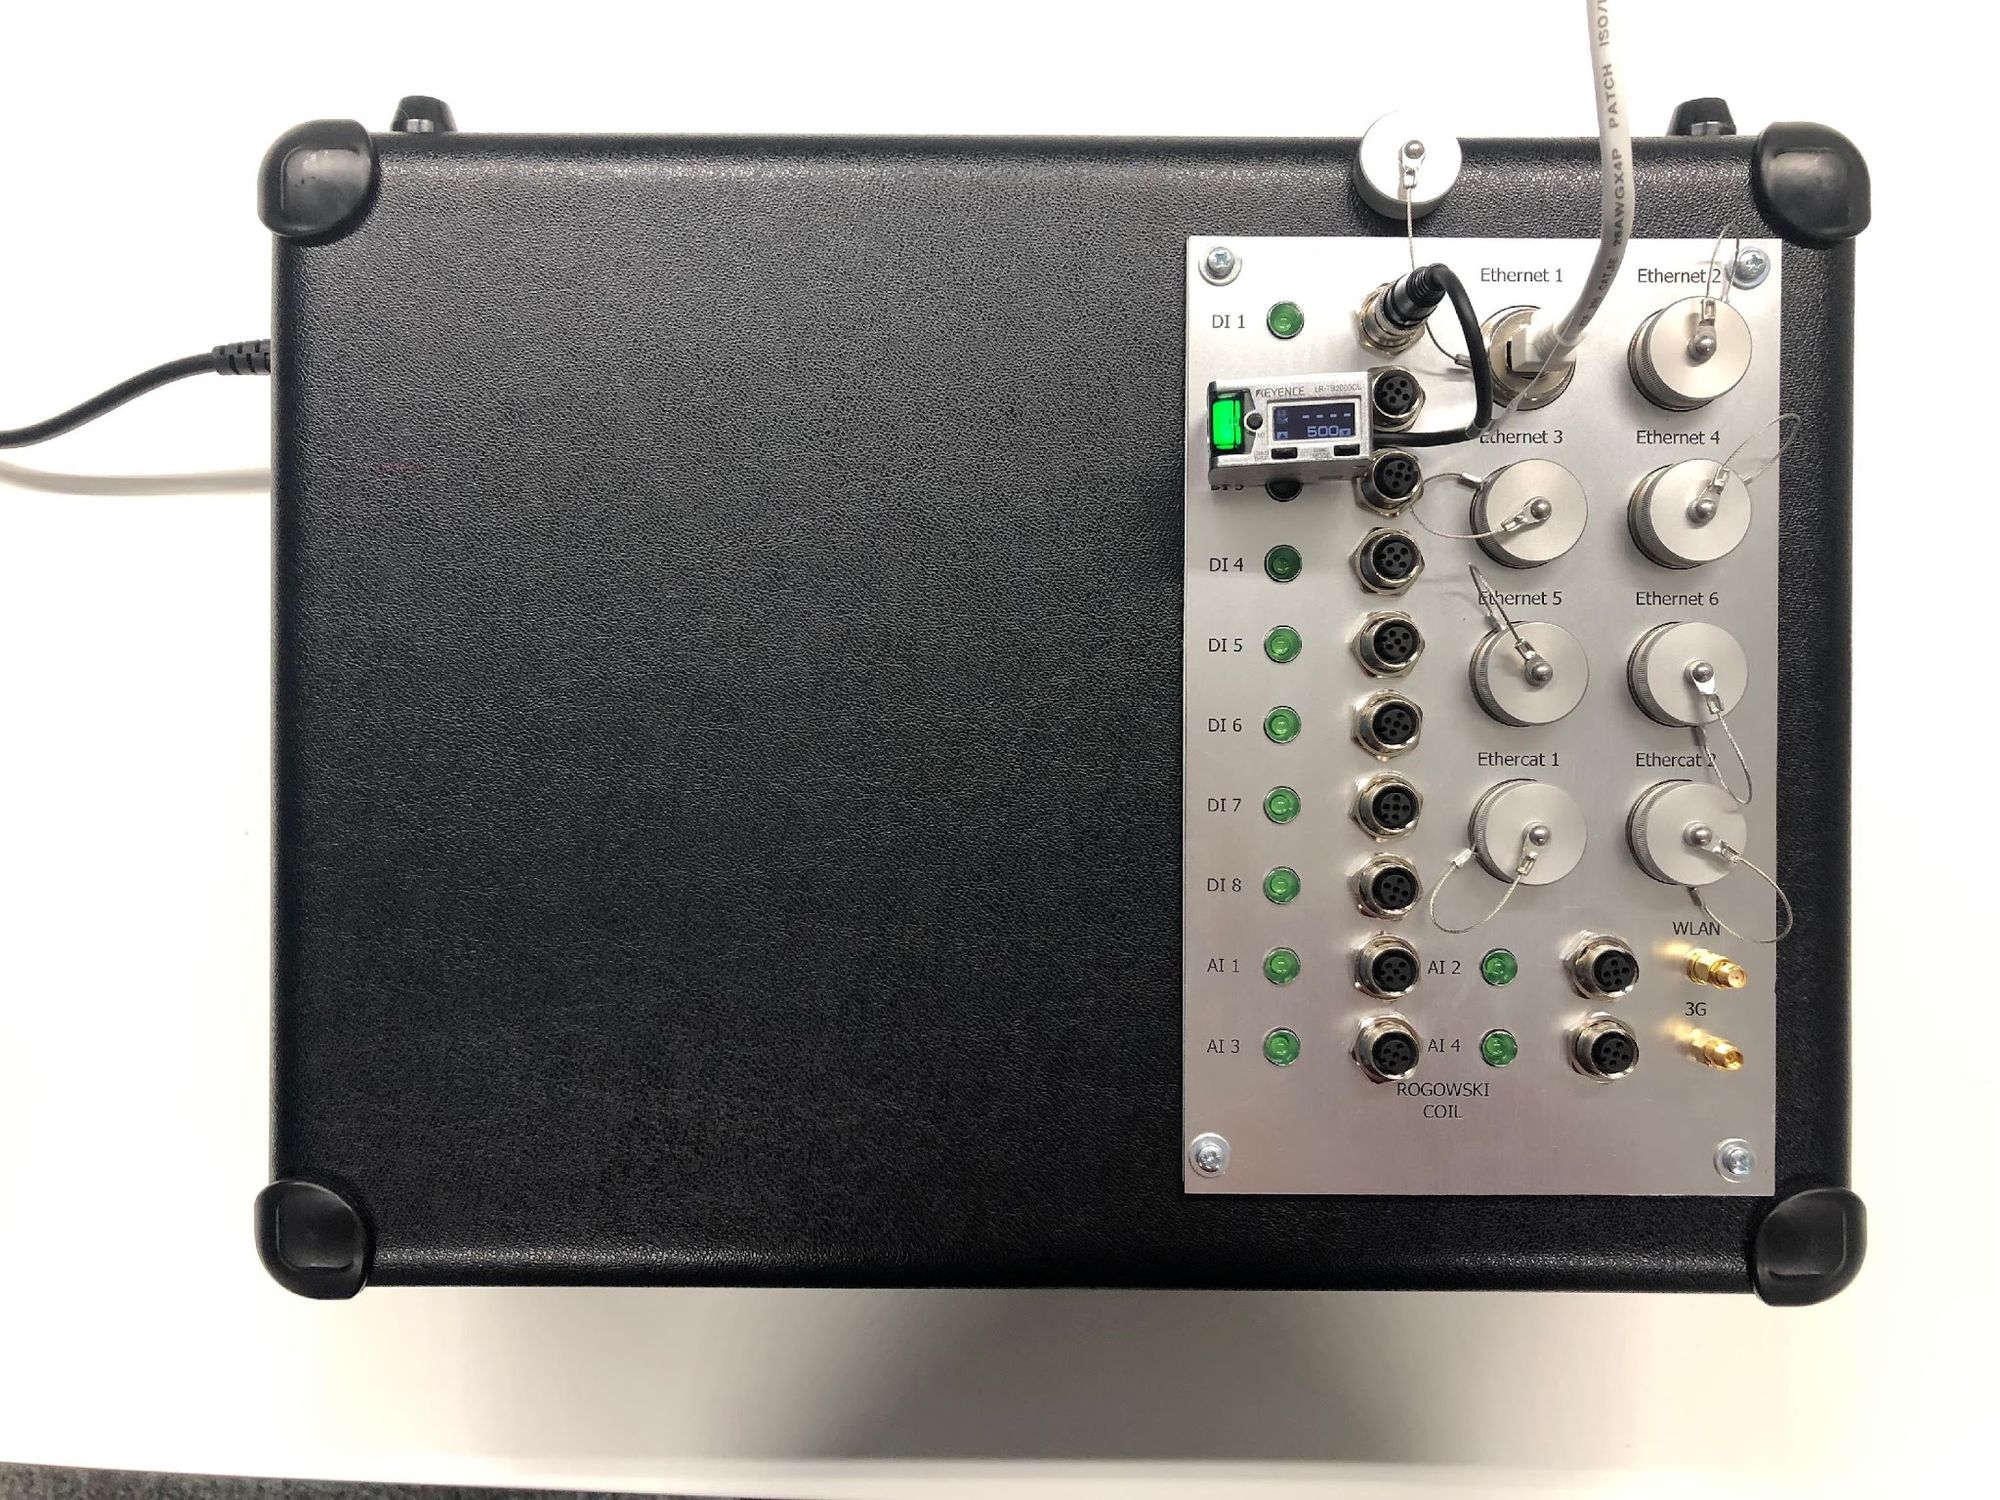
The FactoryCube's primary advantage was its plug-and-play design, making it easy to implement at existing production lines. However, the programming and setup of software and services, such as connecting via MQTT to the VM, relied heavily on the system integrator's IT capabilities. Despite providing a tutorial, the deployment proved challenging, as he chose to not follow it, because he insisted, we were wrong. As a result, we took matters into our own hands, learned PLC programming, and modified the code ourselves.
This solution, even if the deployment was successfull in the end, obviously did not meet our requirements, as it still depended on external capabilities and knowledge and an apparently to complex setup for actual use. Added to the high cost of the initial design (around 12k per device!), the reliance on external system integrators was not feasible and prompted us to create an improved version.
Drawing from our experience during the previous deployment, we designed the second version of the FactoryCube independently, avoiding the reliance on system integrators. At the core of this version was an industrial Raspberry Pi (RevolutionPI), which significantly lowered costs. The system also included a power supply, a router, and a network switch for connectivity.
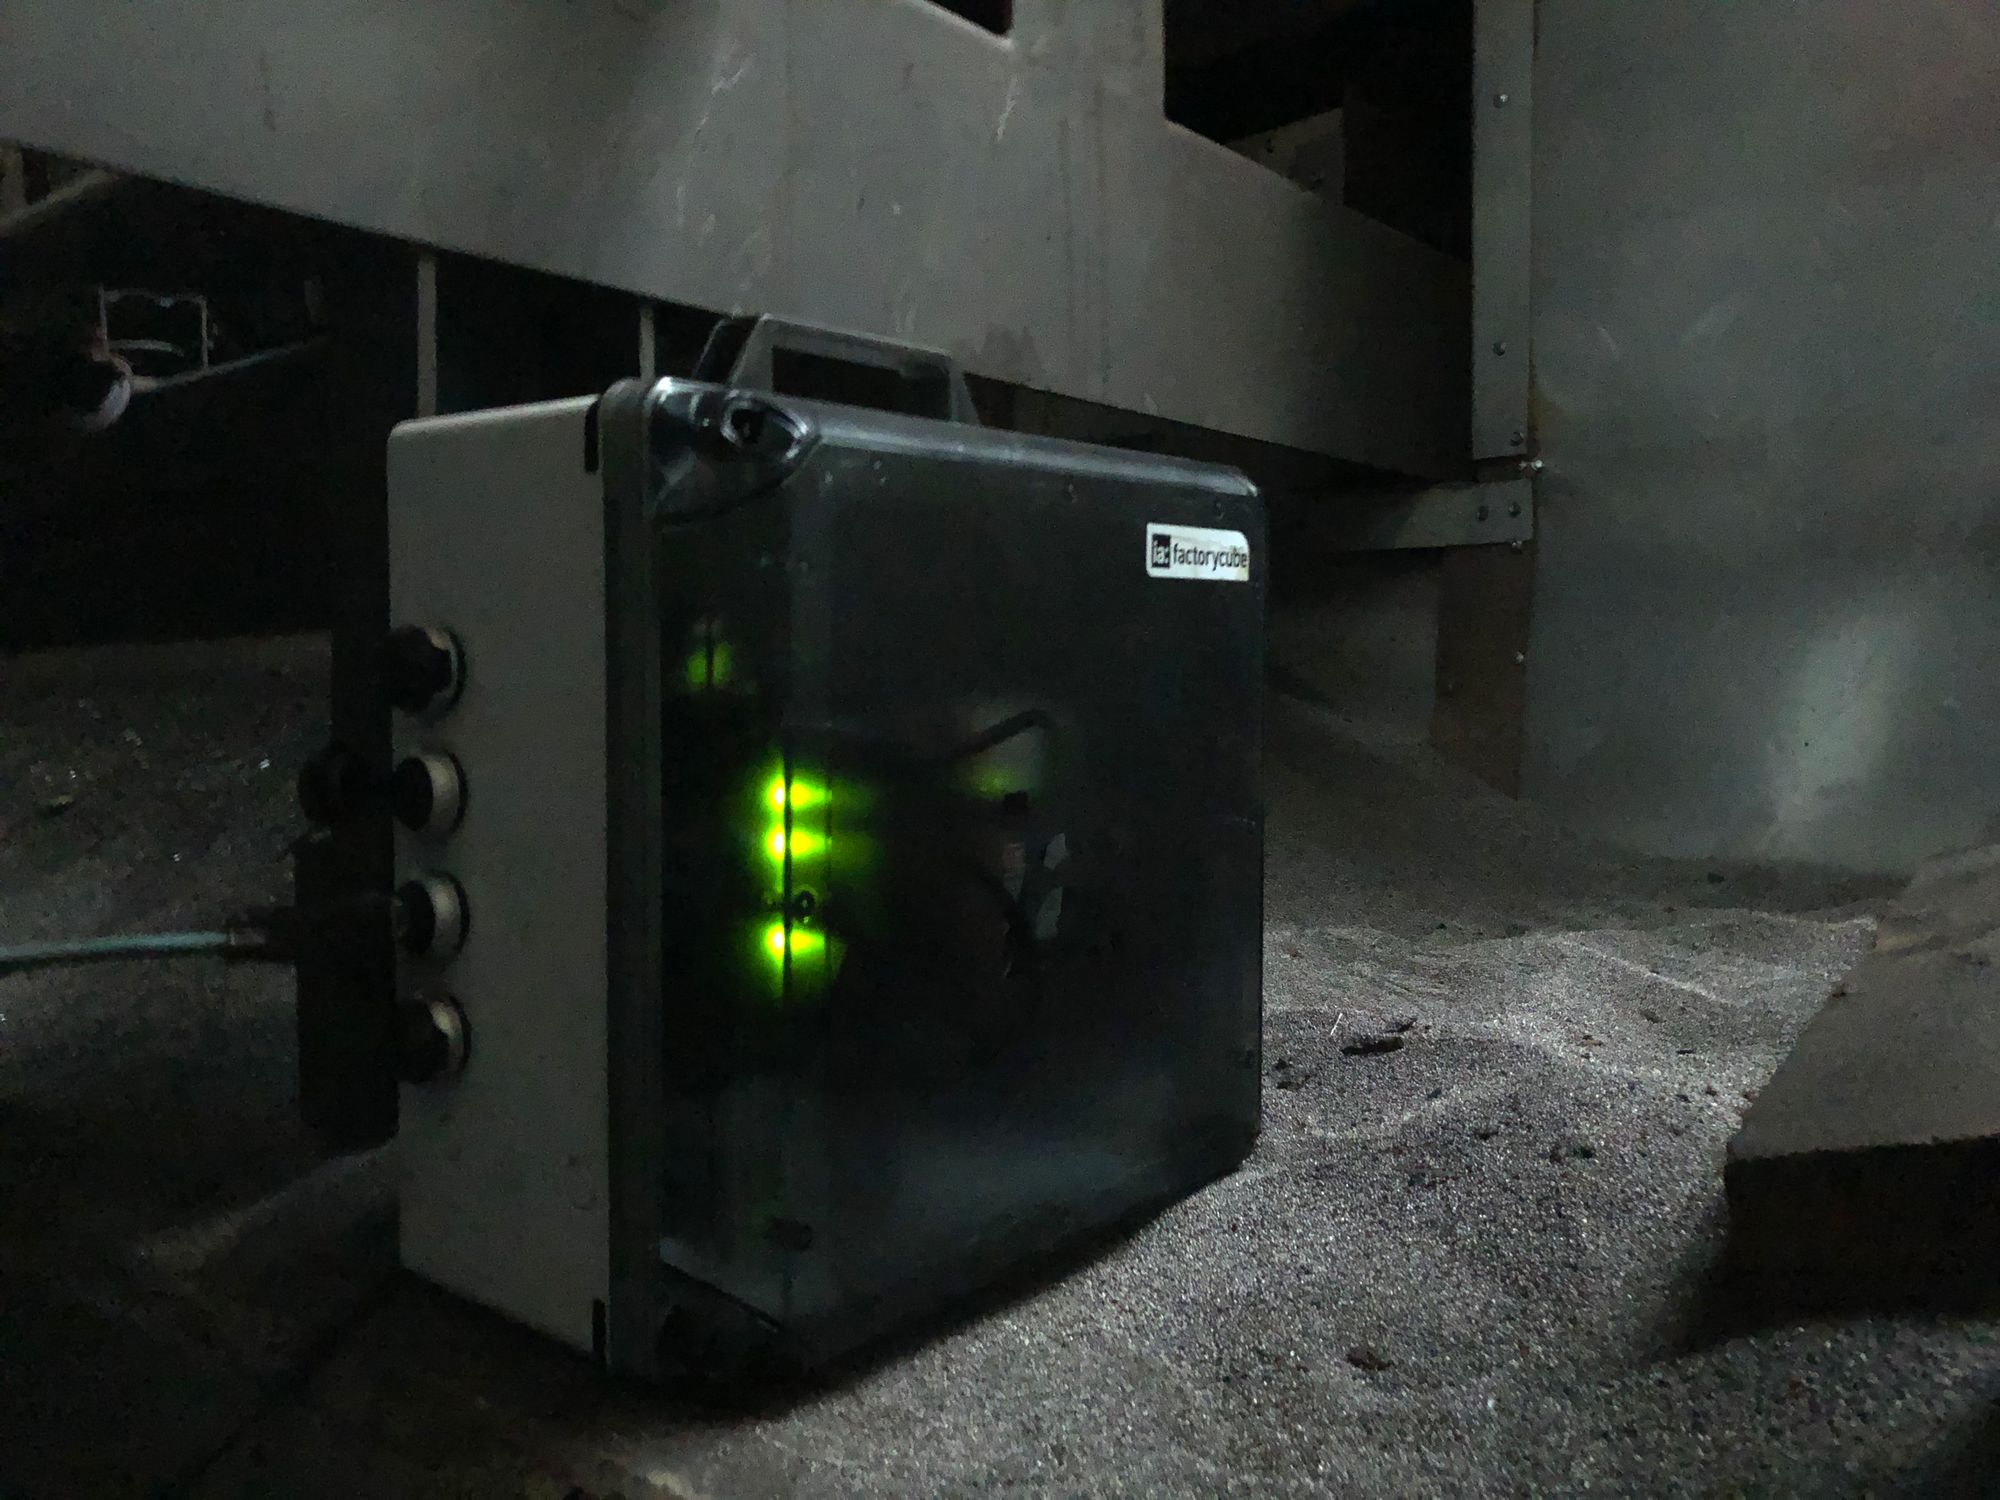
The Raspberry Pi ran a local Docker Compose, Node-RED, and several other tools for data extraction. Data was once again forwarded to the same Azure VM for further processing, this time by the Pi using MQTT. In this iteration, we opted for ifm sensors connected to IO-Link gateways, which transmitted sensor data via Ethernet directly to the FactoryCube. To locate the IO-Links within the network and access the data, we developed a custom tool called SensorConnect, which remains in use today.
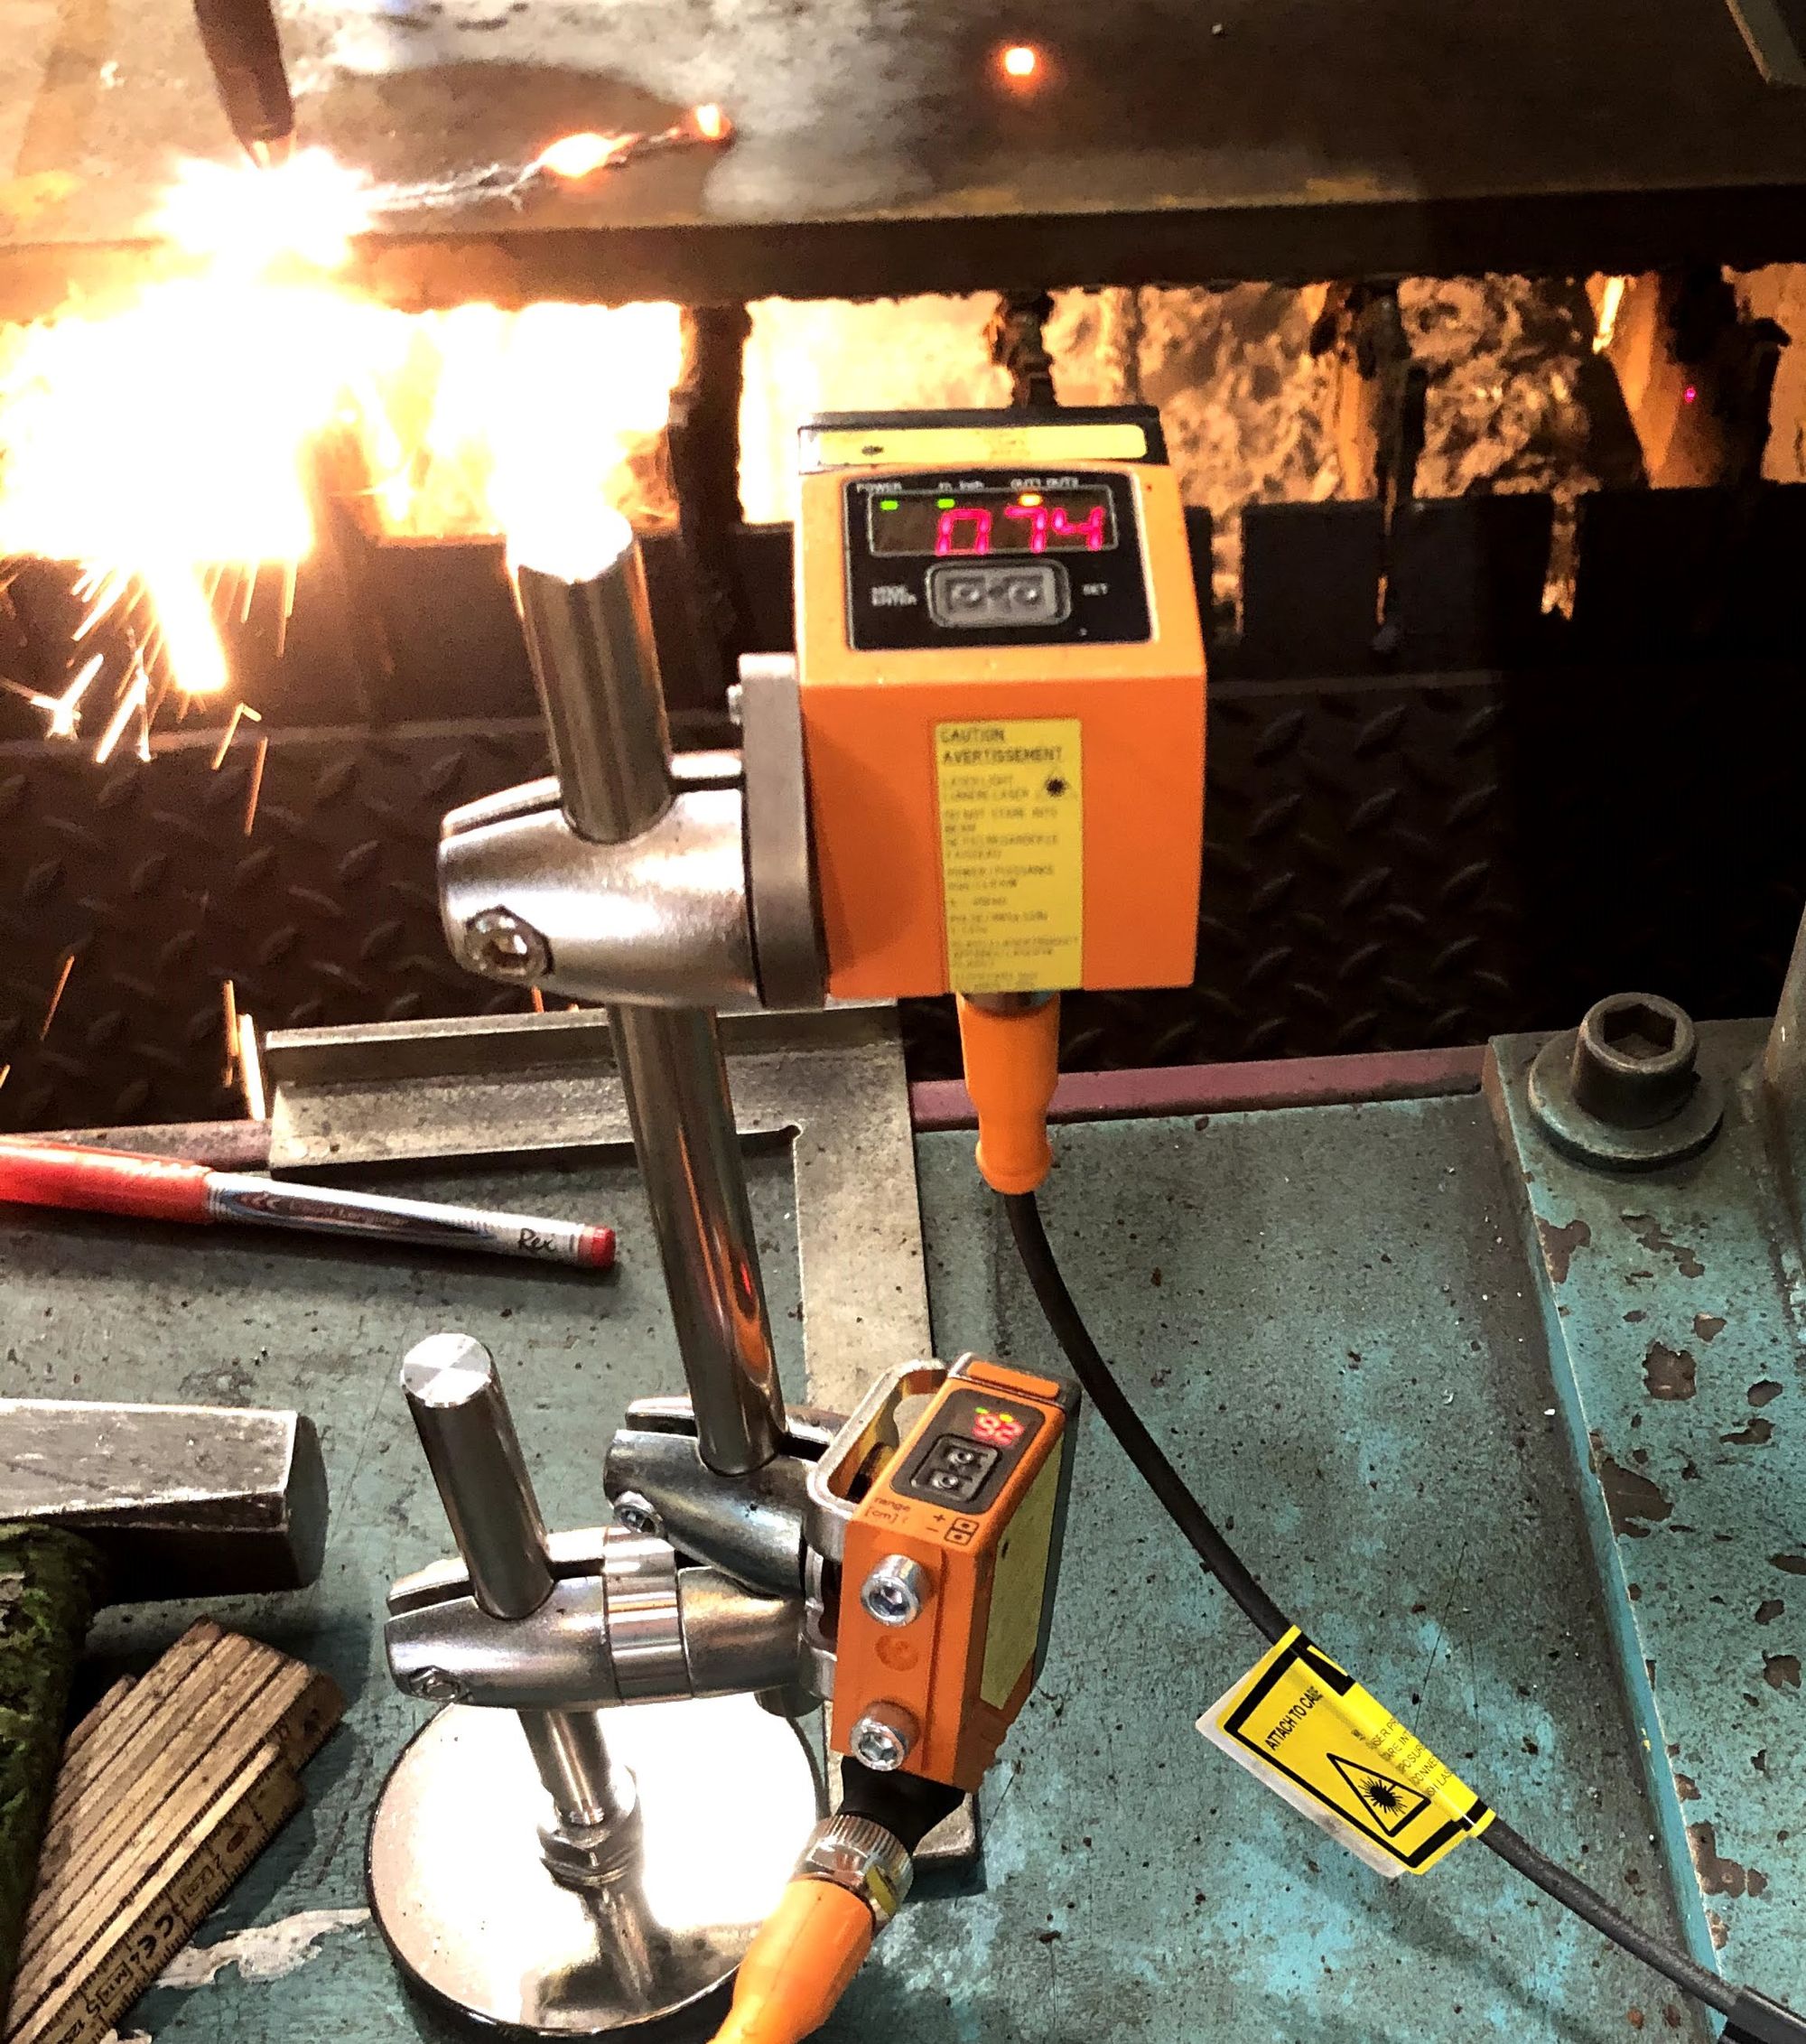
The sensors and IO-Links proved to be highly reliable, resilient, and easy to set up on-site, making the system more flexible. We have not regretted our decision to use ifm hardware and continue to utilize it. In this version, we gradually shifted more logic and processing to the edge device and moved away from an entirely cloud-based approach. This transition was achieved through the use of Node-RED, a tool praised by OT engineers but often criticized by developers. For us, it represents the optimal balance between usability for OT and automation, stability, and scalability.
Pitfall 6: Misuse of Docker-Compose Build and Python Application Logic
During the deployment of new projects, we encountered difficulties in building all the required Docker containers on edge devices and maintaining consistent software versions across them. We SSH'ed into the devices, deployed the application logic in Python, and ran a docker-compose build.
Software version inconsistencies arose when we set up numerous edge devices over an extended period, as updates were released during deployment. For instance, in a retrofitting project involving two factories equipped with new sensors and around 30 edge devices, we had a gap of a few weeks between installations in each factory. New software releases during that time resulted in some devices functioning smoothly while others encountered problems running the necessary services.
To address this issue, we implemented a Docker container registry and utilized pinned software versions, effectively eliminating errors related to bugs or incompatibilities. We shifted as much application logic as possible from Python (programming) to Node-RED (configuration).
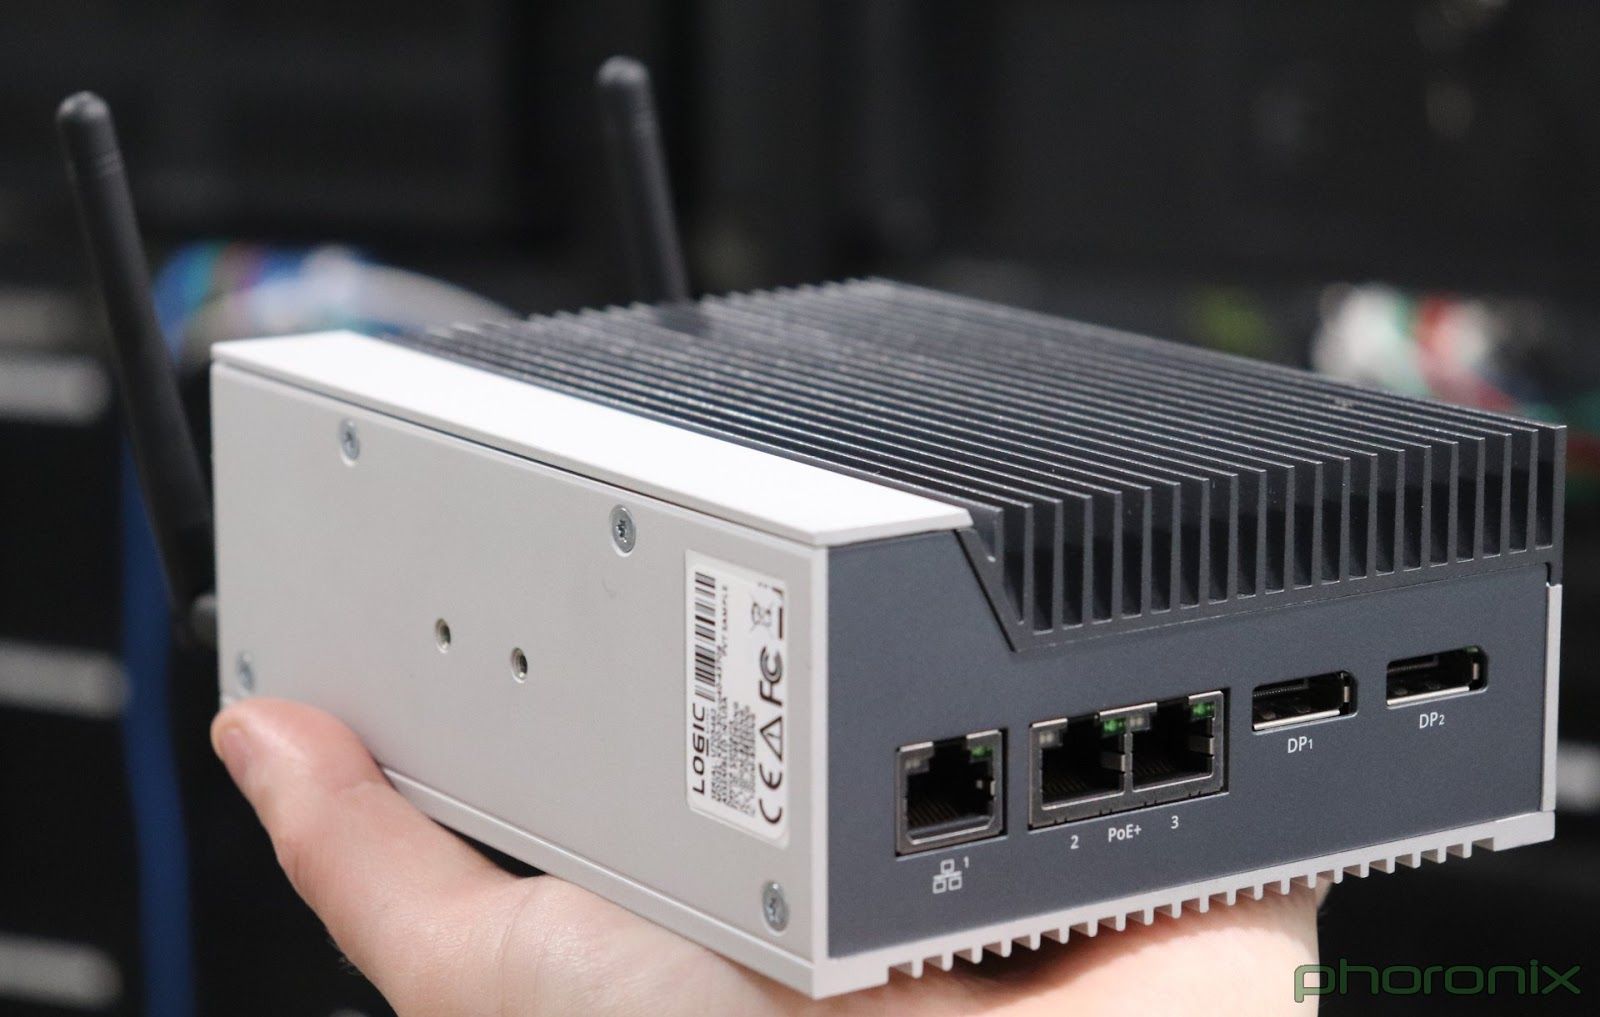
Additionally, we decided to transition from the Raspberry Pi to an IPC as the new platform for the third version of the FactoryCube. This change provided us with increased computing power on edge devices and an x86 architecture for enhanced compatibility.
Pitfall 4 (2/2): Challenges with a Cloud-First Approach
An all-cloud-based approach presented challenges for certain use-cases and even rendered some scenarios unfeasible. Relying solely on cloud-based data processing led to calculation inconsistencies because of the complete dependence on a stable internet connection. Network instabilities can cause drifts between the data accessible on edge and accessible on cloud. In one instance, we displayed the machine status on a light next to the production line. The sensor data was sent from the edge device to the cloud for processing, which determined if the machine was running or not before sending the information back to the light. When the internet connection was unstable, the indicator failed to function despite its proximity to the edge device, significantly reducing customer acceptance of our solution.
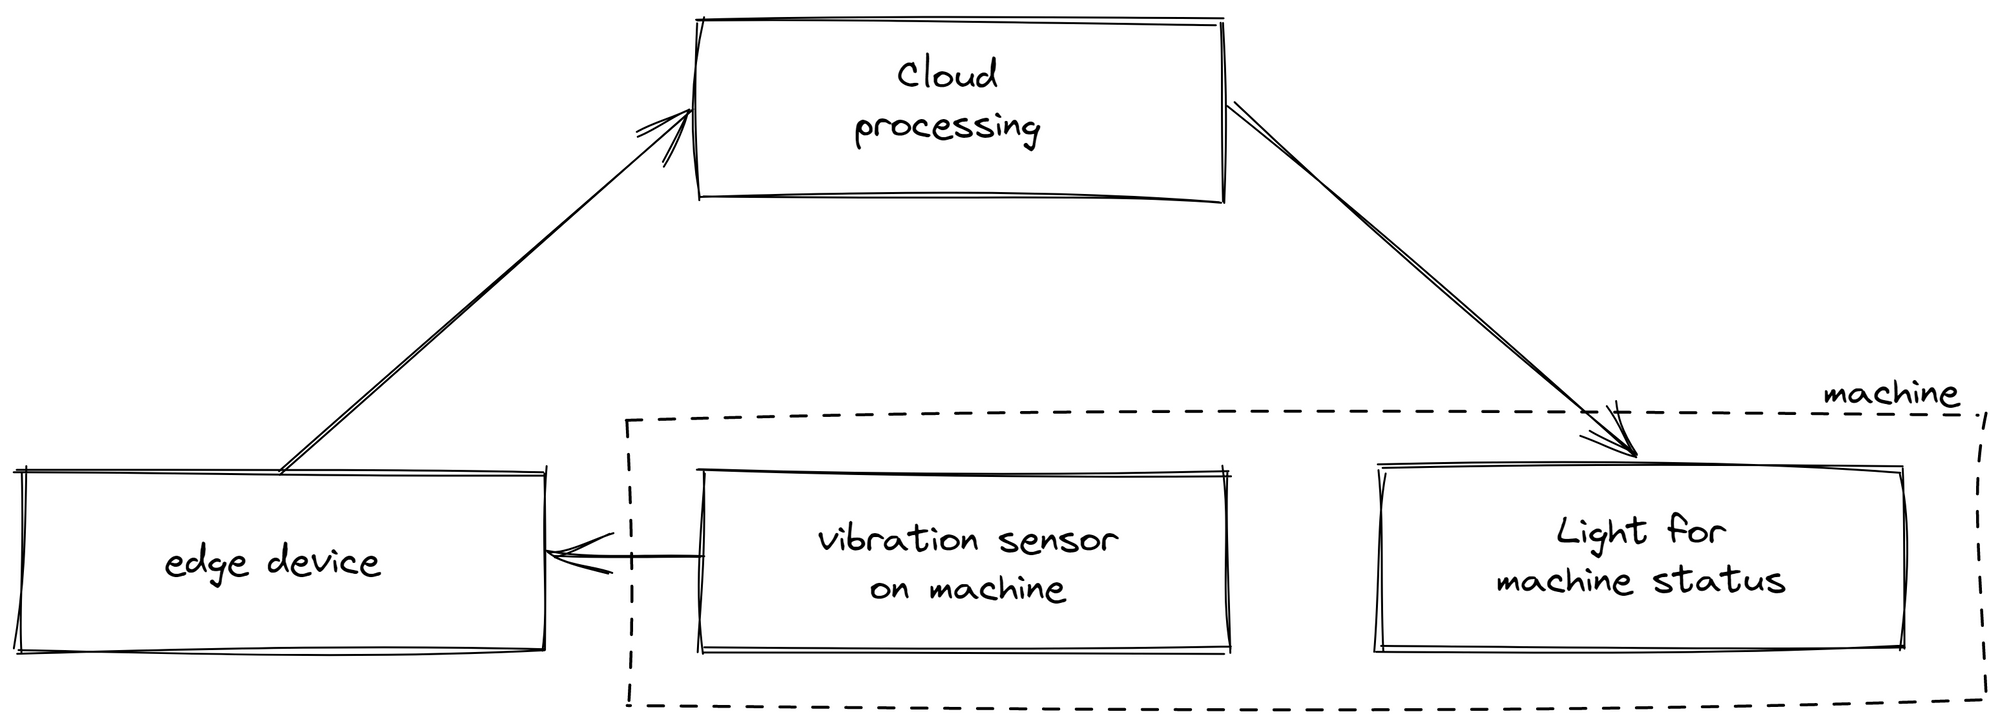
Moreover, this approach not only restricted on-edge logic but also complicated the contextualization of data. As only raw data was sent to the cloud, it required interpretation afterward. This proved inefficient, as deployment and data analytics were performed by different individuals in separate locations. For example, the machine status was determined by a vibration sensor, with different states corresponding to varying vibration levels. The person creating the logic in the cloud might not necessarily know which vibration data indicated a particular status.
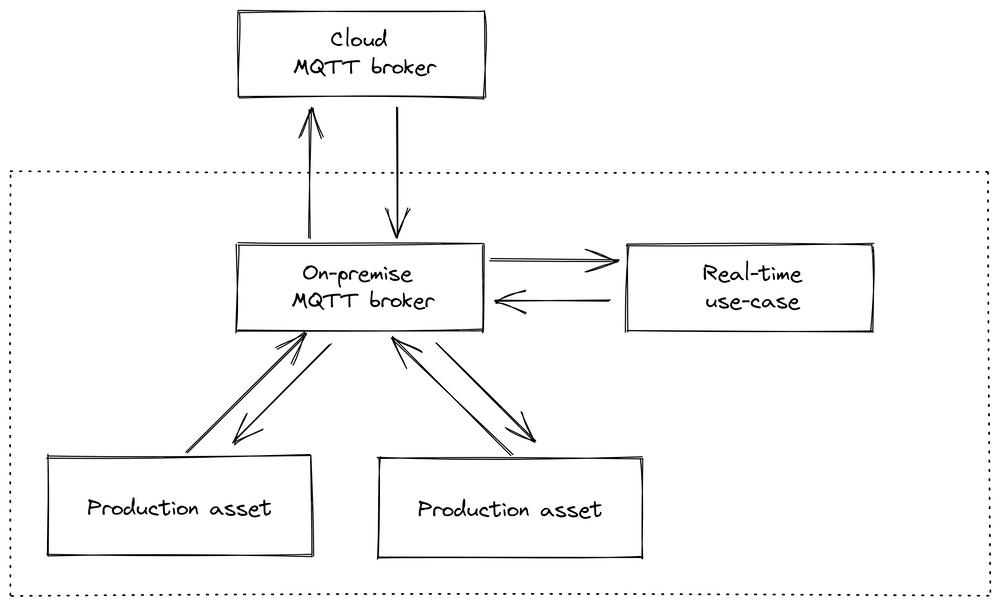
After this experience, we decided to move away from a cloud-based approach for connectivity and data processing. We chose to implement a central message broker (option 3 in the side note, see also image below), as opposed to communication through a database (option 1) or managing data flow through service calls (option 2). In our opinion, both alternatives have significant downsides, such as the inability to perform real-time stream processing with a database or the potential for creating spaghetti diagrams in the case of service calls. A message broker, though it introduces a central component, simplifies the integration of new services or machines, as they only need to connect to a single piece of software and don't rely on other connections like in traditional frameworks.
1. Long-lived databases to store data
2. Short-lived caches to speed up expensive operations
3. Stream processing blocks to continuously process and share data
4. Batch processing blocks to periodically process batches of data
To connect these building blocks, there are three common architecture approaches:
Option 1: Dataflow through databases (e.g., Historian): Real-time stream processing not possible.
Option 2: Dataflow through service calls: Can cause spaghetti diagrams when scaled up and not properly documented.
Option 3: Dataflow through asynchronous message passing (e.g., Apache Kafka, HiveMQ, or RabbitMQ): Introduces a message broker, sometimes called "Pub/Sub" or "Unified Namespace."
In manufacturing applications, which often operate for 10-20 years, the ability to easily add or remove components is crucial. This flexibility prevents spaghetti diagrams and allows for real-time data processing, making the use of a message broker or "Unified Namespace" often the best choice. However, it is a trade-off between maintainability (simplicity) and maintainability (evolvability). Adding a new component to the overall stack increases the likelihood of failure but provides the flexibility to exchange individual building blocks.
More information about architecture as which MQTT broker to chose, can be found in our MQTT Broker Comparison article.
We opted for MQTT as our first broker due to its simplicity and ability to handle millions of devices, and we implemented an event-driven architecture with one broker per factory. This approach reduced our reliance on internet connections, improved data transparency, and facilitated the easy integration of new use cases, such as on-edge data processing. Different factories could be connected through an additional cloud-based MQTT broker, which managed the data flow between plants.
This structure shifted more logic and data processing to the edge device and made the switch from a Raspberry Pi necessary, as more on-edge computing power was required.
2020-2021: Deployment and Reliability challenges
In 2020 and 2021, we underwent significant changes, leading to the creation of the United Manufacturing Hub as it stands today in its architecture.
Pitfall 7: Docker Compose Limitations
As our architecture evolved and new projects emerged, we increasingly encountered challenges with Docker Compose. While it did allow us to manage our microservices, it required significant manual intervention, making it difficult to scale our operations efficiently.
For instance, suppose you need to manage 20 to 30 edge devices for a retrofitting use-case, each requiring connectivity, database, and visualization capabilities. Each device should be used for three month per customer with individual adjustments to measure the OEE and then return to us. After returning, each device had to be set back to the default settings. When using Docker Compose, the following steps would be required for each of these edge devices:
- Re-/Install the Operating System.
- Clone the repository with the Docker Compose file.
- Make minor adjustments and perform a
docker-compose up(avoidingdocker-compose build, as mentioned in Pitfall 6). - Log into InfluxDB, fetch the generated secret, go to Grafana, and add it as a data source.
- Carry out other "smaller adjustments" such as importing templates, changing default configurations, etc.
These seemingly minor tasks collectively added up to significant time and effort. Moreover, training staff to set up these devices led to the inevitable introduction of errors, whether through incorrect setup wizard selections or typographical errors. As a result, devices often needed to be set up again, further wasting resources.
To address these issues, we transitioned to a more robust solution: Kubernetes in the form of k3s, combined with Helm and k3os as the Operating System. This change enabled us to fully automate steps 1 through 5. We merely had to input all requirements into a single file and press 'provision.' This greatly reduced the potential for errors and improved system reliability. It also enhanced reproducibility - in the event of hardware failure or user error, a perfect setup could be restored in just 20 minutes.
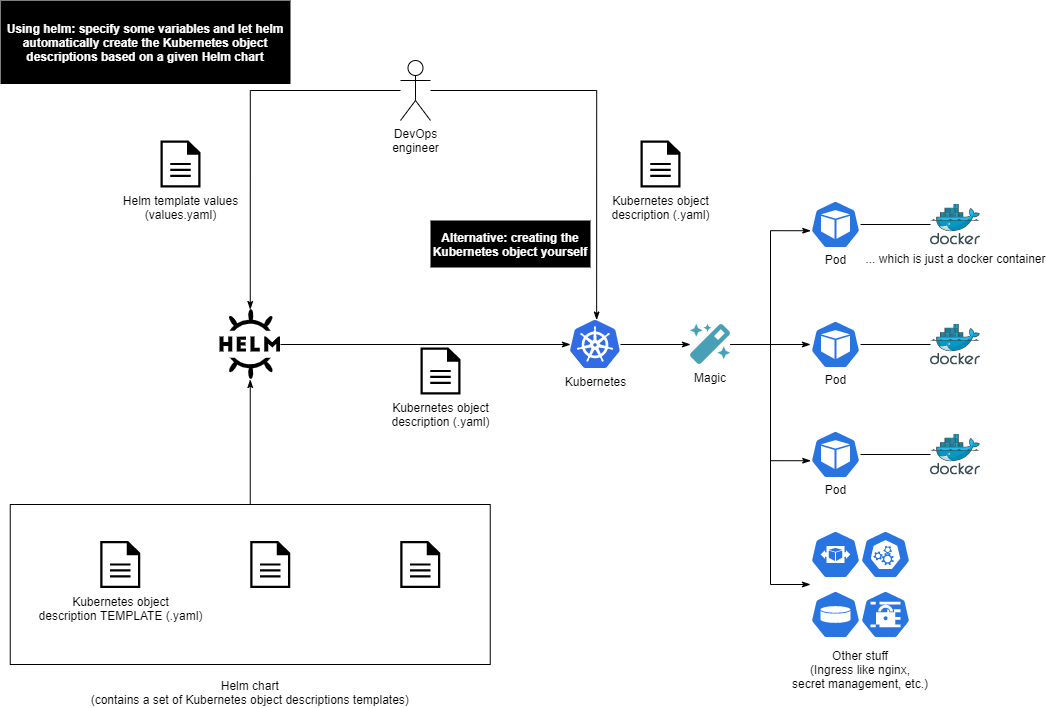
More information on Docker, Kubernetes and Helm can be found in our learning hub
Pitfall 8: Instabilities of InfluxDB and Relational Data
Our quest for an optimal database led us to transition from InfluxDB to TimescaleDB. Our projects required the handling of both time-series and relational data, which often poses a challenge. Initially, we chose InfluxDB due to its compelling marketing and our familiarity with it from home automation projects. It offered a user-friendly interface and continuous queries for data processing, making it seemingly ideal for our needs. However, we soon discovered that this was a misguided decision.
In one project, we had to process raw machine data, such as converting light barrier data into machine status. Simultaneously, we needed to store information related to shifts, orders, and products using InfluxDB.
To say the least, InfluxDB was not a suitable fit for that use-case: Continuous queries frequently failed, often without any error message. Flux, the query language of InfluxDB, was relatively new and more challenging to handle compared to SQL. We found ourselves having to write Python scripts to process data due to the limitations of Flux - tasks that would have been straightforward in SQL. This experience underscored the need for a change.
While software rewrites can address fundamental issues and introduce new features, they often result in breaking API changes and unanticipated bugs. This leads to additional migration projects, consuming valuable time and posing risks such as system downtime or data loss. We observed a tendency for InfluxDB to prioritize new feature development over product stability, to justify its significant funding. For instance, the introduction of a proprietary visualization tool seemed to compromise stability, and adapting to the changing API proved demanding.
Furthermore, InfluxDB only offers horizontal scalability in its paid version, potentially deterring larger-scale deployments due to the risk of vendor lock-in.
We ultimately chose TimescaleDB as our new database, which is built on PostgreSQL. PostgreSQL had already been in use and further development for over 25 years and had proven itself to be highly reliable and robust. This can be attributed, in part, to its ability to continue functioning even in the event of a failure. Another significant advantage is the ease with which it can be scaled horizontally across multiple servers. This change provided a great relief, allowing us to focus on our product without constantly fixing breaking API changes. For more information and an in depth comparison, check out our blog article.
Pitfall 9: Solely Relying on MQTT or Kafka, Instead of Using Both
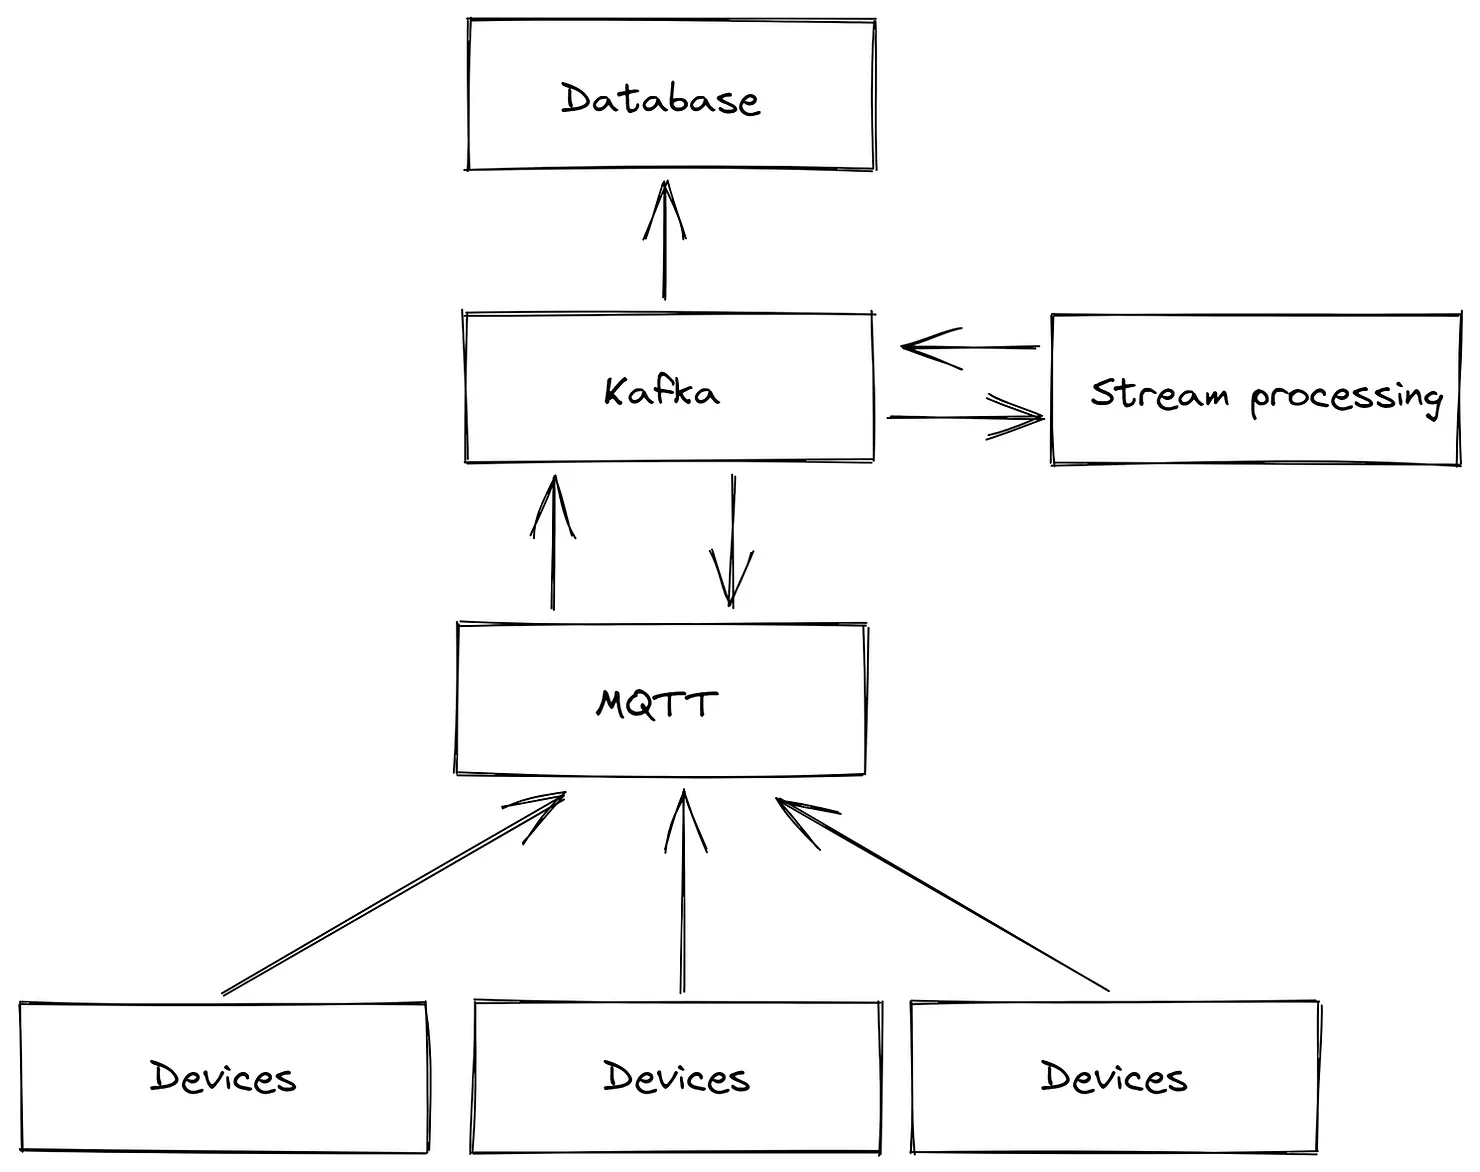
As our development progressed, we found it essential to transition from using MQTT as our sole message broker to a combination of MQTT and Kafka. We made this shift because MQTT, while reliable for maintaining connections with a vast number of devices, was not designed with fault-tolerant and scalable stream processing applications in mind. Furthermore, we faced issues with MQTT bridges. However, completely replacing MQTT with Kafka would also not be ideal, as Kafka is not particularly suited to handling situations where consumers or producers frequently go offline and then return online.
Here's a practical example illustrating the limitations of MQTT: Consider a simple setup involving a light barrier and two microservices. Microservice A sends a count message each time a product crosses the light barrier. Microservice B, on the other hand, increments the tally of processed products each time it receives such a message. If Microservice B receives too many messages simultaneously, it might crash and restart, leading to lost messages. The likelihood of encountering such edge cases increases with each additional device, making this progressively more of an issue.
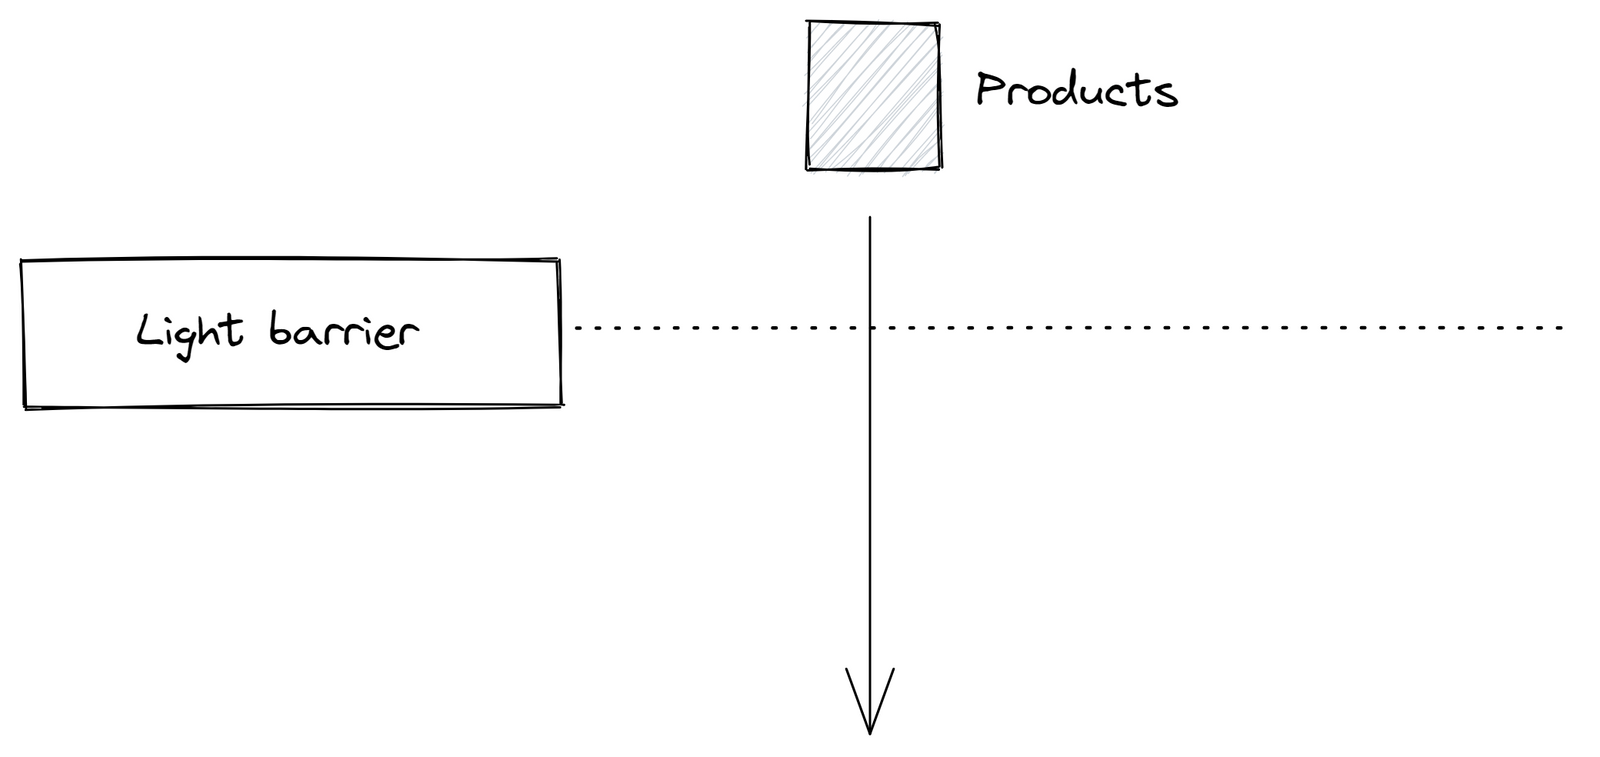

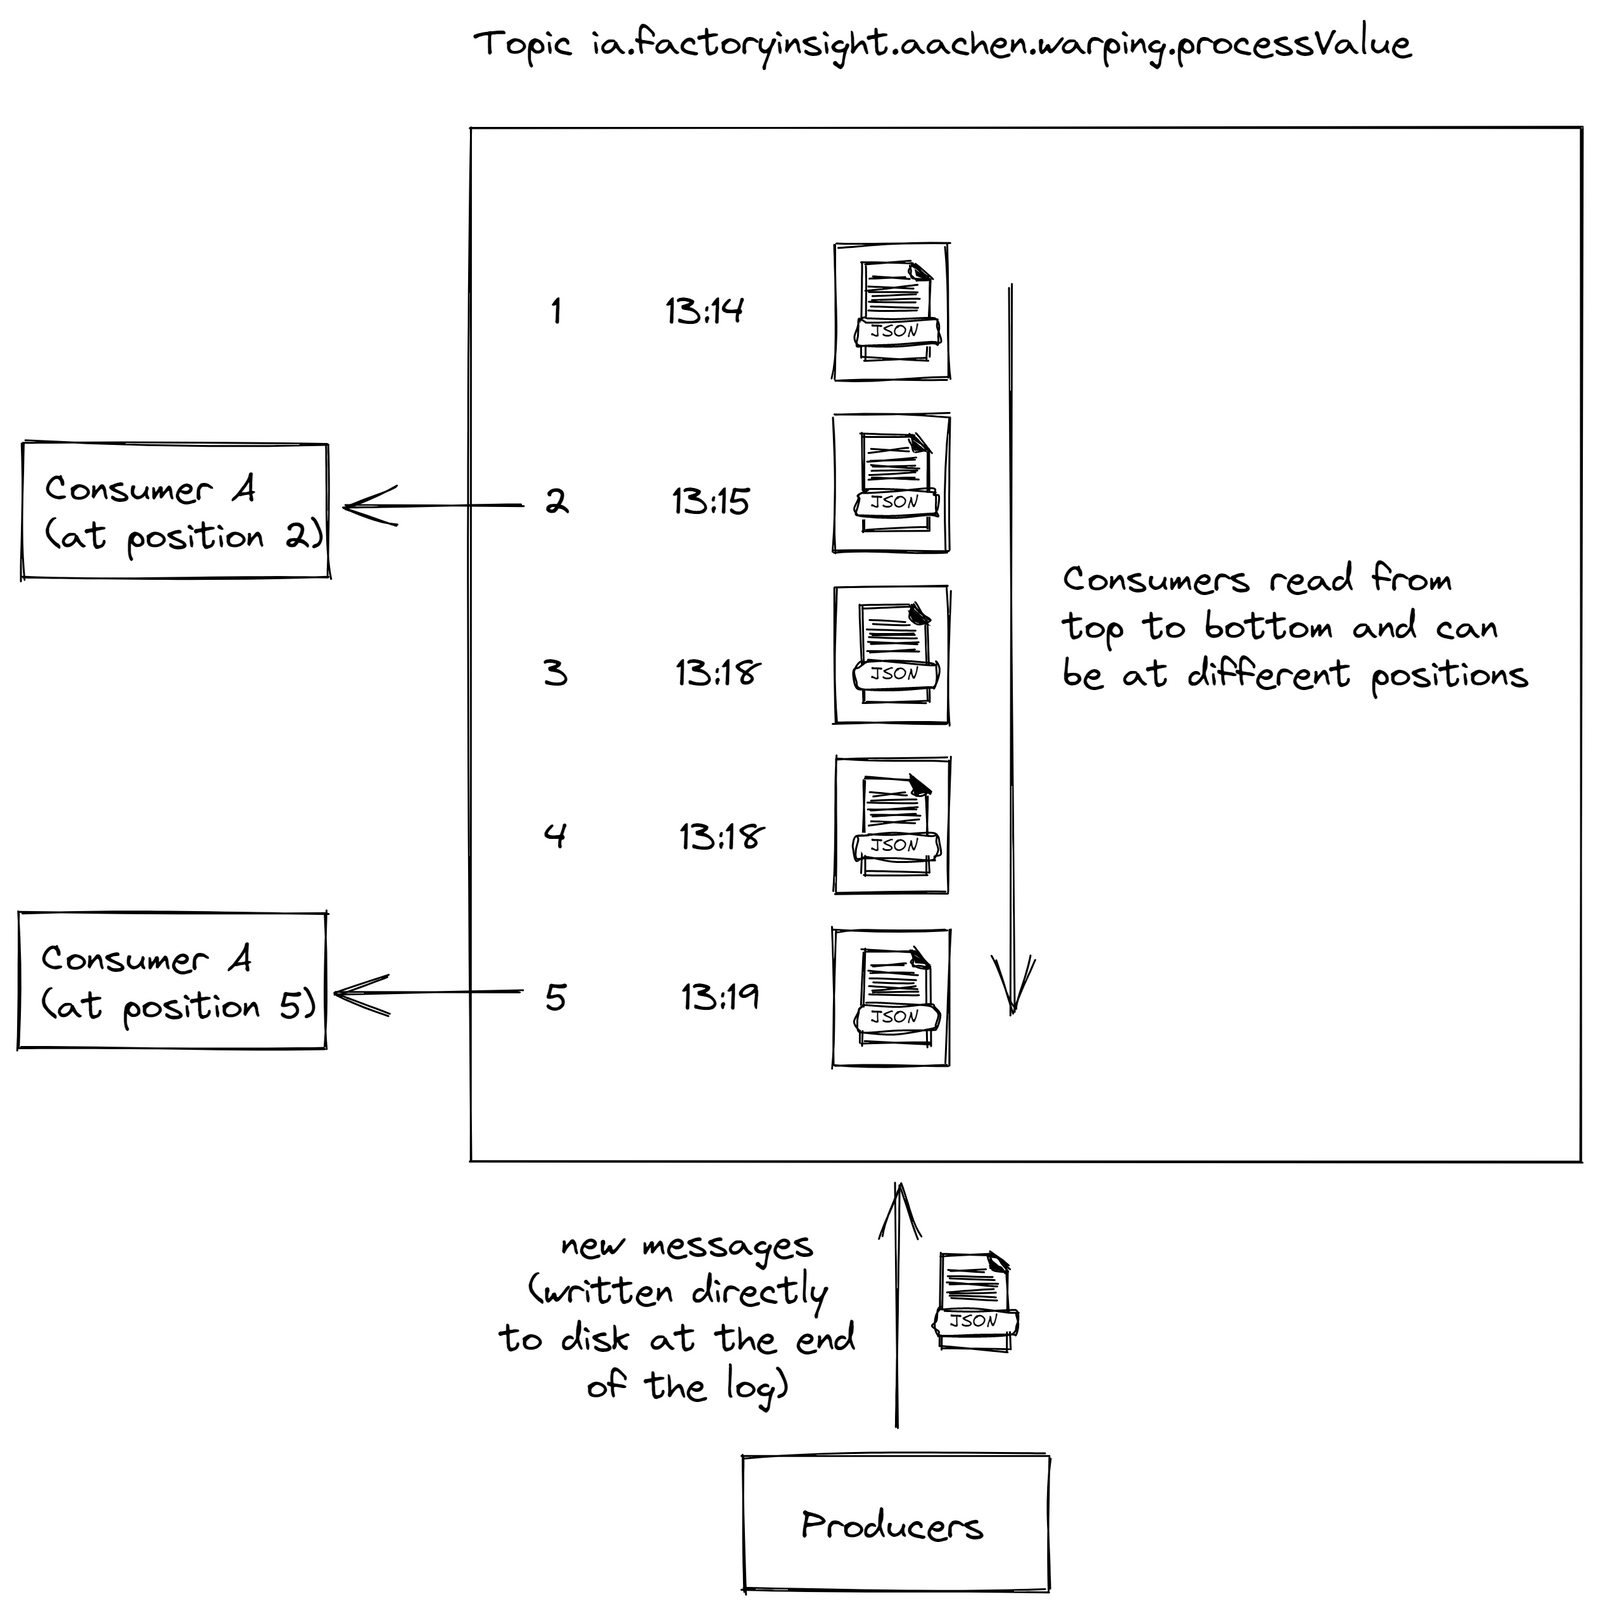
Kafka offers a solution by recording events in a log file, ensuring guaranteed message ordering, zero message loss, and highly efficient exactly-once processing, even under challenging circumstances.
We settled on a blend of Kafka and MQTT, where messages are first transmitted via MQTT and then processed through Kafka for stream processing. This architecture has been recognized as an industry best practice for large-scale data management and processing. It safeguards against microservice overloads, as each consumer processes data at its own pace. In the event of a crash, a restarted service can simply resume from where it left off, enhancing the reliability of the system.
Pitfall 10: Attempting to Construct Your Own VPN Using OpenVPN or Similar Tools

One less extensive but critical update we made involved replacing OpenVPN with Tailscale for our VPN needs. Establishing a VPN for remote device access can become quite complex with OpenVPN, particularly when outgoing connections are necessary. We used a docker-compose for OpenVPN, which created a unique OpenVPN server for each device, ensuring complete isolation between devices (since they were located at different customer sites). This setup required meticulous OpenVPN configuration, a laborious process that was ultimately unnecessary for our needs. We were not primarily focused on high-speed connections, but rather reliable connectivity for emergency situations.
In our experience, Tailscale proved to be a more efficient choice for our requirements. It has consistently performed well, even through corporate firewalls, which are typically tough to navigate.
2022 - now: Current State and future of the United Manufacturing Hub
Over the past couple of years, our fundamental and open-source architecture has demonstrated a strong record of stability and reliability, warranting only minor adjustments. Key changes include replacing VerneMQ with HiveMQ to increase acceptance within larger enterprises. We also switched from k3os to Flatcar after the unexpected deprecation of k3os. Another notable change was the shift from Kafka to RedPanda, aimed at improving maintainability on edge devices.
At the moment, we are working on three topics:
- Development of a Consistent ISA95-Compliant Data Model. Our existing data model, while admittedly imperfect, has proven effective across various industries, primarily due to its simplicity for shopfloor integration. For instance, it never demands data that are typically unavailable at the PLC level, such as OEE or detailed order histories. Instead, it utilizes established standards like Weihenstephaner or PackML, aligning closely with available PLC data. Currently, we're aligning this model with ISA95 standards while standardizing naming conventions across MQTT, the database, and the API. You can find a preview of this model here. We're also keeping a close eye on the development of Sparkplug B, particularly its potential for JSON payloads and flexible topic structures.
- Stream Processing and Data Contextualization Accessible to OT Engineers. While IT-oriented tools like Spark and Flink offer scalability, they're not quite user-friendly for OT personnel, who are typically responsible for inputting calculation logic and performing contextualization. On the other hand, many OT-focused tools we've evaluated fall short in applying IT best practices, proving difficult to scale and manage. This challenge led us to develop our own OPC-UA connectivity service, which you can learn about here. We're currently exploring different possibilities in this area.
- Creation of a Comprehensive Management Console. We've identified a common challenge within manufacturing companies: the uncertainty about assigning responsibility for single building blocks - from an edge device over VM up to applications. Is it the domain of OT, maintenance, IT, or the cloud department? This ambiguity often leads to unnecessary expenditure or avoidance of such architecture altogether. Our solution is the development of a Management Console, a unified platform that oversees all stack components. From provisioning new devices and monitoring the health of hardware, microservices, data streams, and applications, to configuring with versioning and audit trails - all from a single location. If you're interested in learning more, don't hesitate to reach out to us!
Summary
Designing and implementing a resilient IT/OT infrastructure is a multifaceted endeavor, demanding a nuanced understanding of both IT and OT domains, judicious balancing of cost and quality, and an ability to foresee potential challenges. In developing the United Manufacturing Hub, we traversed a labyrinth of obstacles and adaptations, learning invaluable lessons along the way. Here are the ten critical pitfalls we encountered and navigated:
- Harmonizing IT and OT Solutions: The distinct differences between IT and OT domains posed challenges in integrating and scaling various solutions, necessitating a fine-tuned understanding of both.
- Misconception of Low-Code: Low-code solutions required substantial coding for complex individual adjustments, challenging the initial perception of these tools being easy to integrate and user-friendly.
- Underestimating the Importance of OT Certifications: Attempting cost-effective solutions with non-certified OT Hardware led to malfunctions and difficulties in troubleshooting, negating their initial cost benefits.
- Challenges with a Cloud-First Approach: An attempt to modernize using a cloud-first approach ran into issues like network instabilities, access difficulties and customization limitations. An all-cloud-based approach led to calculation inconsistencies and complete dependence on stable internet connections.
- Overestimating IT Competence of OT System Integrators: Despite the simplicity of our solution, deploying it often required substantial IT knowledge, highlighting the importance of not overestimating the IT competence of OT system integrators.
- Misuse of Docker-Compose Build and Python Application Logic: Deploying new projects and maintaining software version consistency across edge devices proved challenging when using Docker Compose and Python application logic.
- Docker Compose Limitations: Docker Compose proved inefficient for managing microservices, especially when scaling operations.
- Transition from InfluxDB to TimescaleDB: The inability of InfluxDB to handle both time-series and relational data effectively, combined with frequent failures, necessitated a transition to TimescaleDB.
- Solely Relying on MQTT or Kafka, Instead of Using Both: Solely using MQTT or Kafka fell short when it came to scalable stream processing applications, necessitating a combination of both.
- Attempting to Construct Your Own VPN Using OpenVPN or Similar Tools: While enabling the establishment of a VPN, OpenVPN was complex and challenging, especially for outgoing connections.
Our journey through these pitfalls has shaped the United Manufacturing Hub into a robust and reliable platform that navigates the complexities of IT/OT infrastructure design. As we continue to evolve and innovate, our experiences guide us in our mission to create a user-friendly and effective IT/OT infrastructure.
Interested in trying out the United Manufacturing Hub? Go check it out!


