


The Unified Namespace arises from the need to address limitations in standard Operational Technology (OT) practices. Let's start with the basics of OT and the automation pyramid's role in it.
The Automation Pyramid
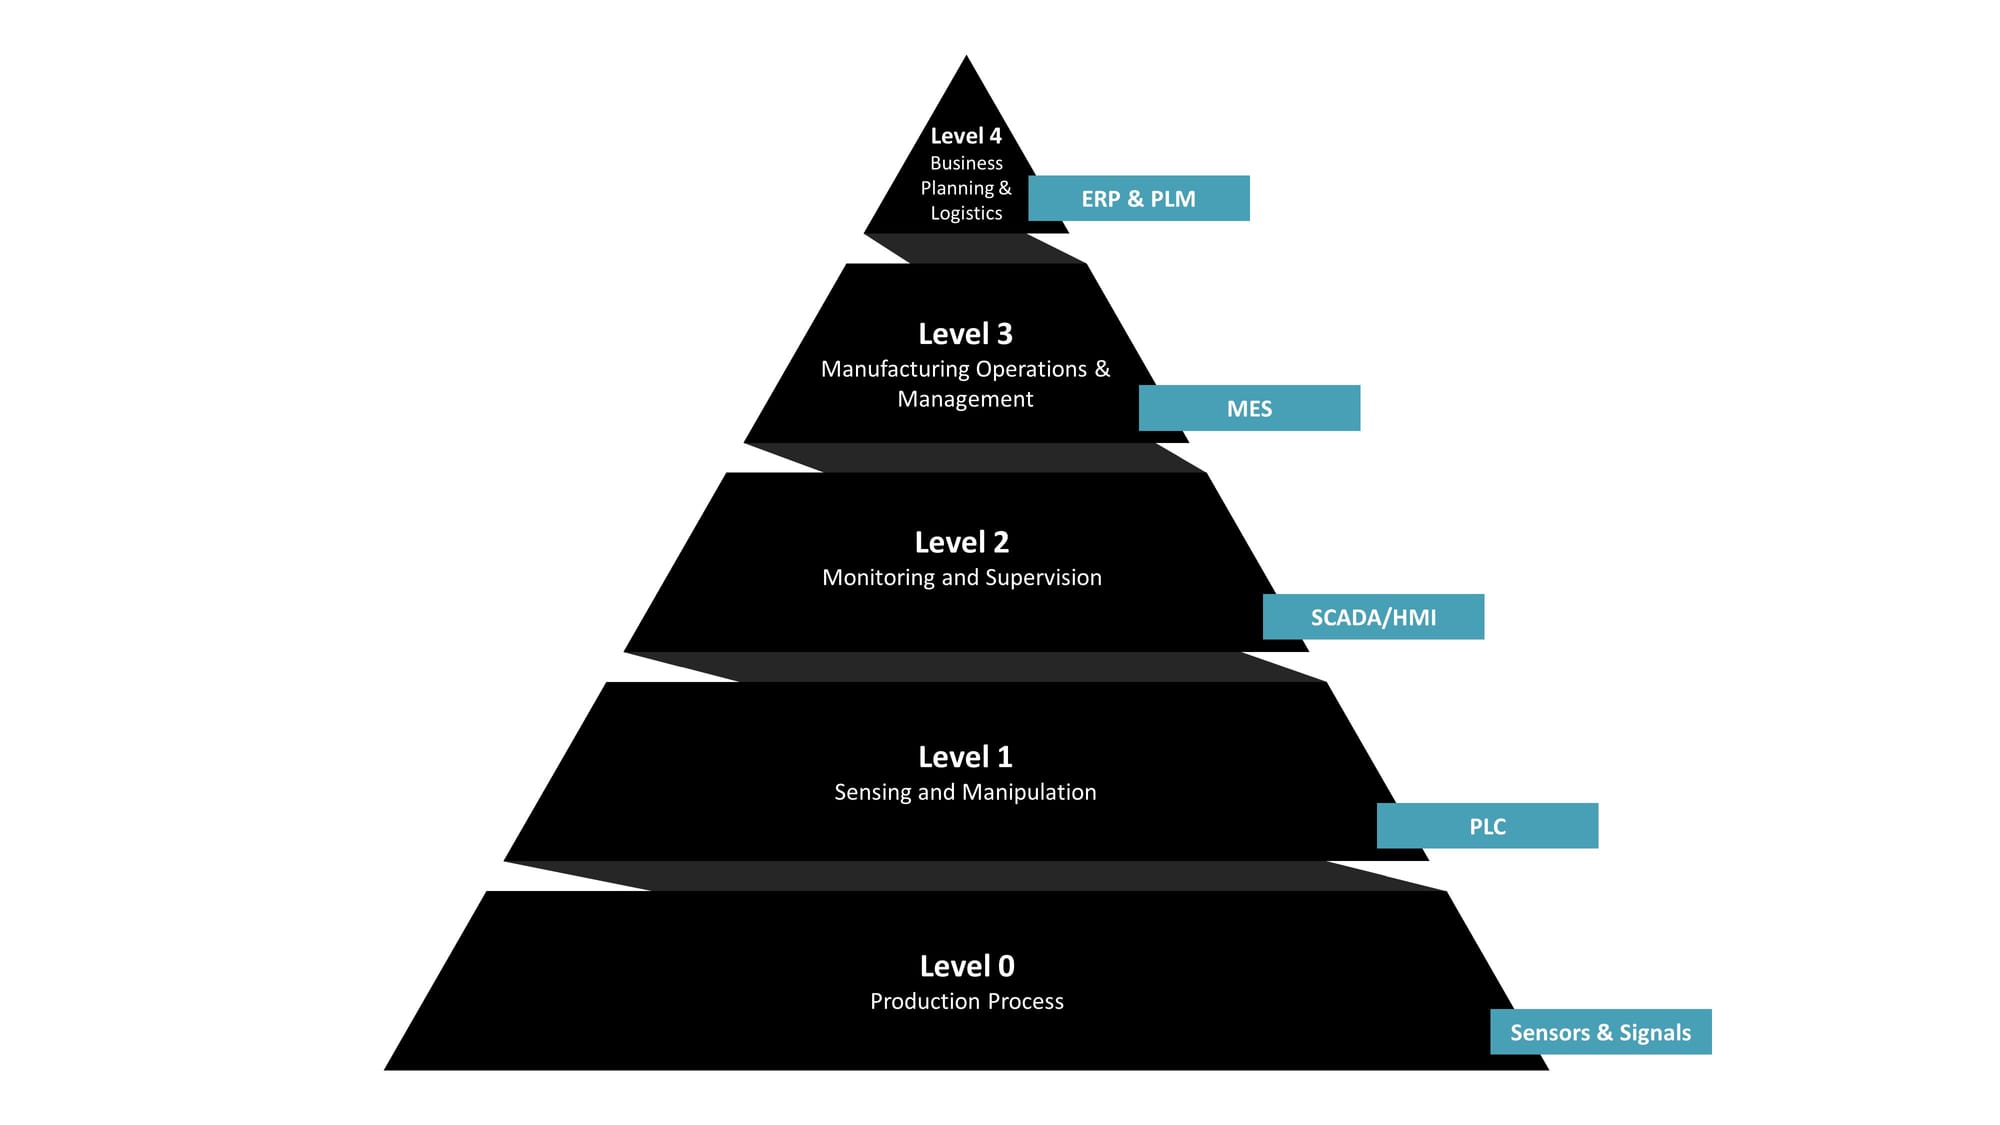
For IT and management professionals, the Automation Pyramid is a key concept. It's a structured representation of how data in a manufacturing setting moves from the production floor to strategic decision-making levels. The pyramid aligns with the ISA-95 standard, offering a framework for understanding factory control systems. It's a bridge between IT and OT: the higher you go, the more you lean towards IT with aggregated data; the lower, the closer you are to OT and the hardware.
Challenges of the Automation Pyramid
Unfortunately, the traditional Automation Pyramid faces significant challenges in today's data-driven industrial environment. These challenges are not just some small technical hurdles; they are actual very expensive barriers to innovation. Why do manufacturing companies find it hard to have a simple dashboard with analytics, like a list of all orders and a live progress bar for each order's production? A big reason is the automation pyramid, despite its benefits:
Data Aggregation and Loss: In the traditional pyramid, as data moves up from the PLC level, it undergoes aggregation, which might seem efficient but comes at a significant cost: the loss of detailed information. For instance, in vibration monitoring, the raw data essential for machine learning models is lost in aggregation. Similarly, in filling industries, the exact timestamps of produced items are replaced by simplified batch summaries. This data simplification, while useful for basic reporting, strips away the granular details for continuously improving the production such as identifying bottlenecks or understanding production patterns.
Firewall Barriers: Multiple firewalls protect the shop floor, creating a fortress around the data. While this is crucial for security, it turns accessing data into an odyssey, especially for data scientists. To access data at the PLC level, one often needs to be physically present at the machine, or navigate through multiple VPN tunnels and jump hosts across different organizational segments. This time-consuming and non-automatable process severely restricts the use of data for advanced analytics and real-time decision-making.
Integration Hurdles: Imagine the challenge of creating a unified dashboard that displays real-time production data alongside ERP/MES information. For example, a dashboard that shows all upcoming and completed orders from the ERP/MES system, and the current progress of each (both in terms of quantity produced and pending production). In the traditional pyramid, this requires a complex, multi-step data flow across various levels – from PLC for current production stats to ERP/MES for order lists – each layer separated by its own firewall. This setup not only makes it expensive and time-consuming to implement new applications or dashboards but also leads to rigid structures. Once set up for a specific purpose, any minor change can disrupt the entire system, often leading to a reluctant acceptance of suboptimal setups.
Transmission Inefficiencies: Higher levels of the pyramid, like ERP and MES systems, are designed for transactional data processing (OLTP), not for handling large volumes of analytics data (OLAP). This design limitation means that even if we manage to transmit data from lower levels, these systems might not support or efficiently handle it. Because of this, companies frequently create specialized data flow processes tailored for specific situations. For instance, they might transmit a progress indicator in percentage (0%-100%) rather than the actual number of pieces produced per second. Any shift in requirements can make the entire system outdated (e.g., adding a rate of progress display), leading to additional costs or, worse, a reluctance to implement necessary changes.
Does this mean we should discard our existing systems? Absolutely not! Absolutely not! Instead, we can significantly improve our already existing setup by adding the Unified Namespace.
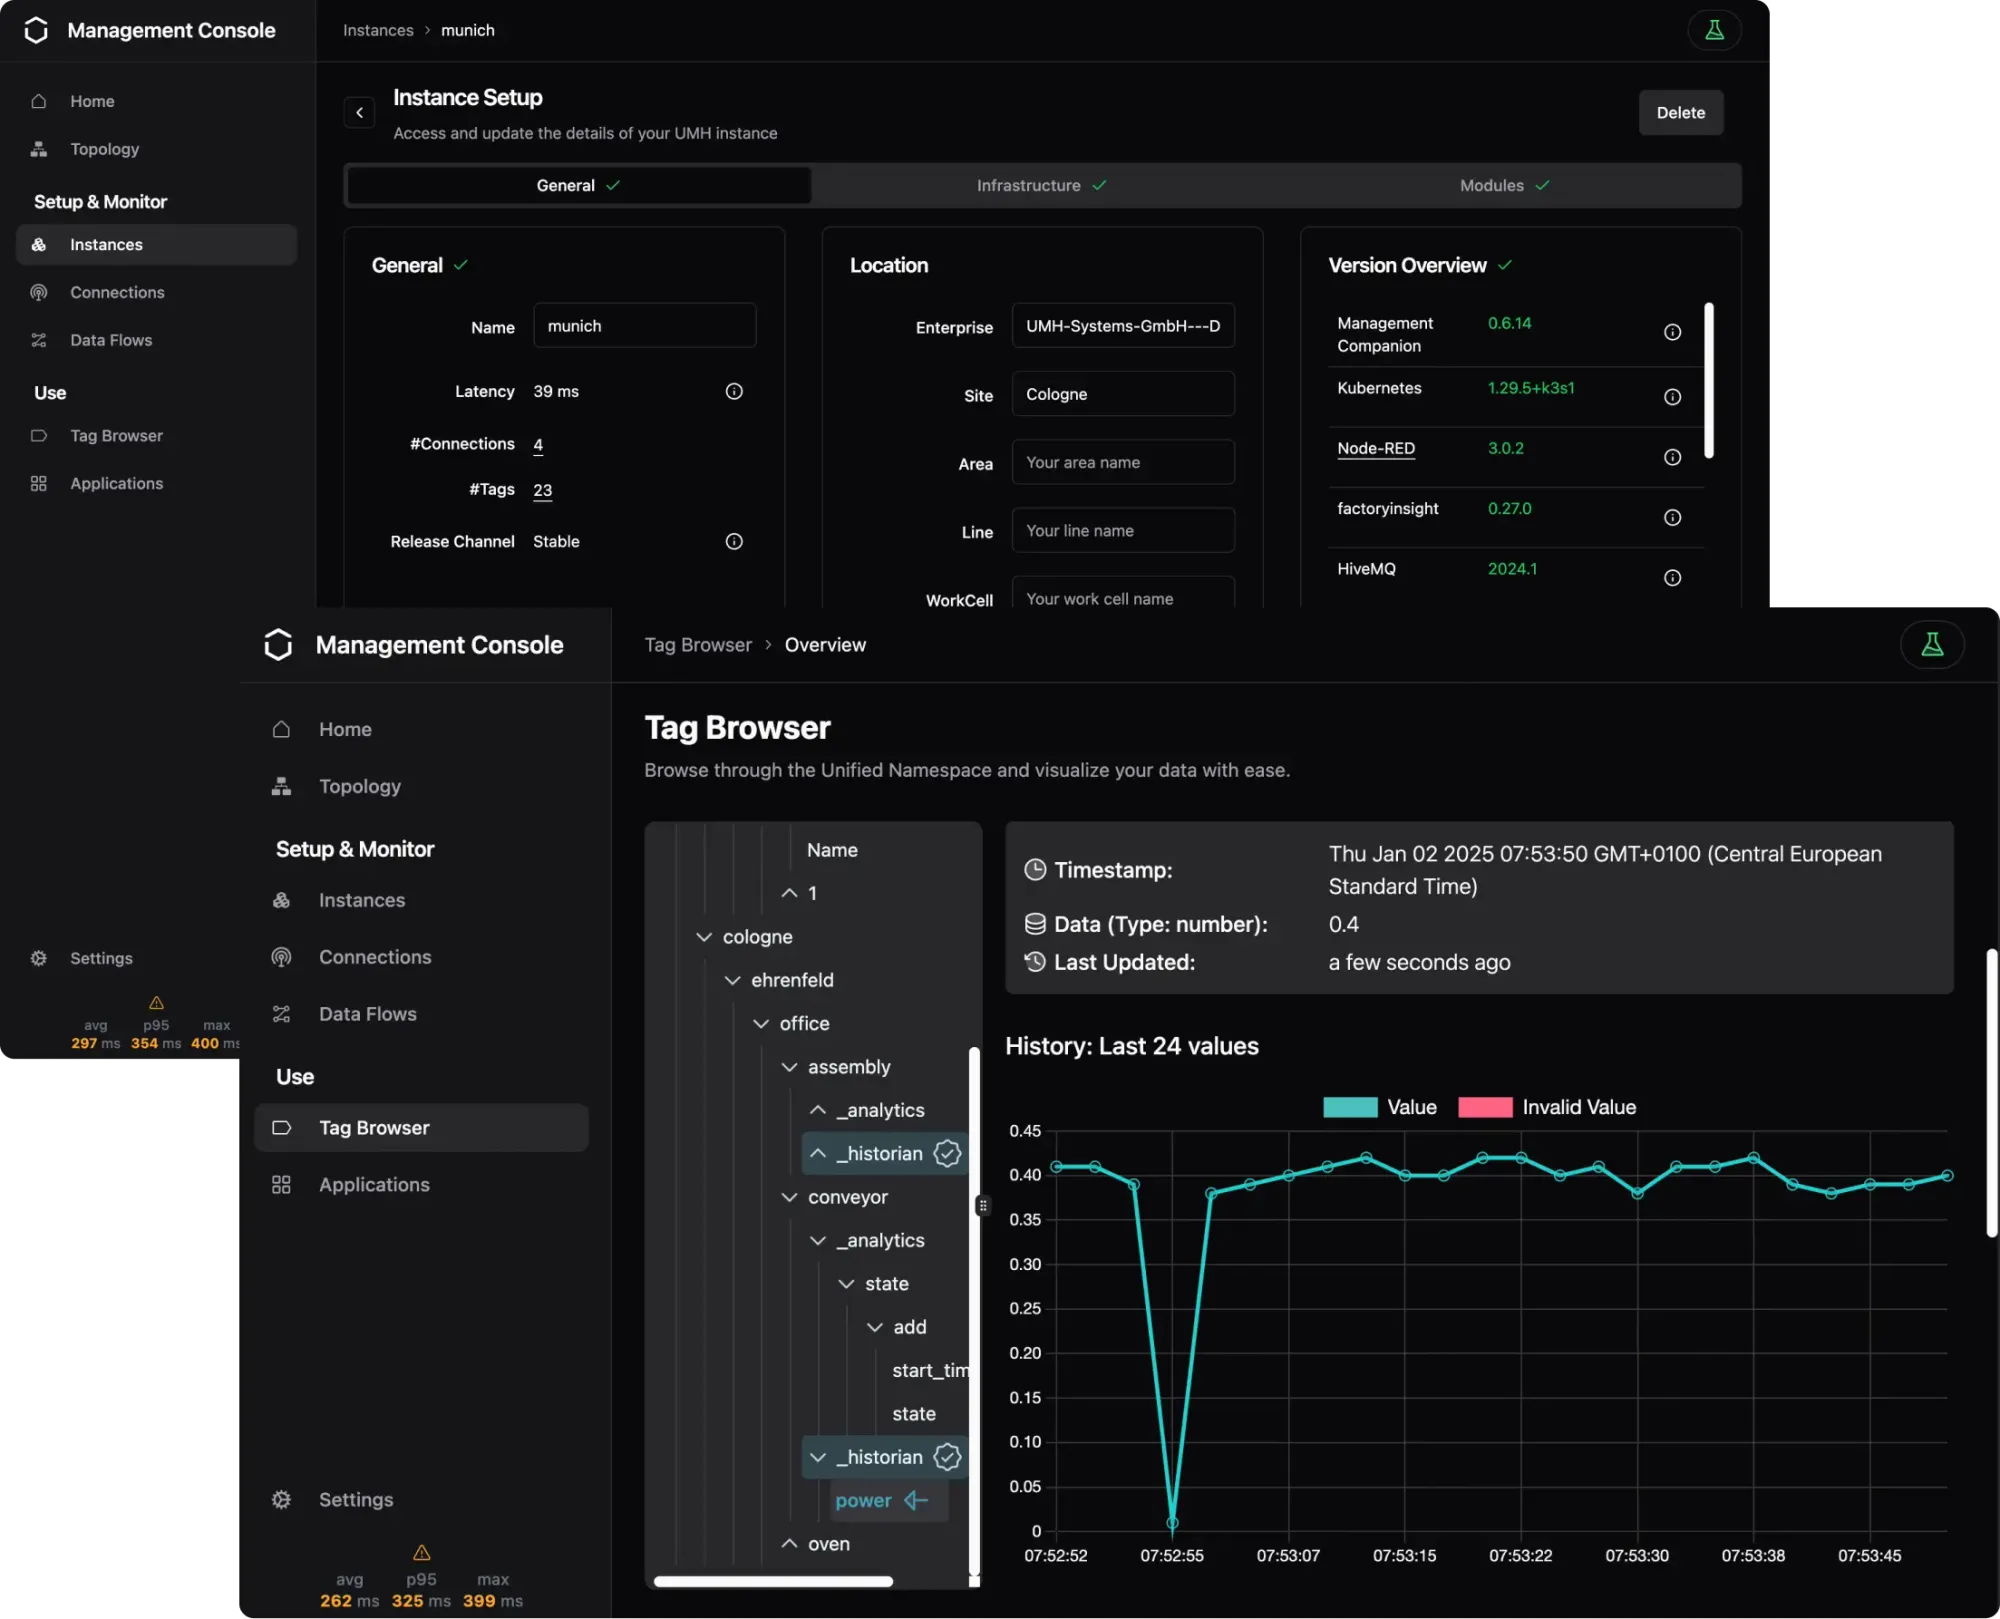
IT / OT Integration Platform for Industrial DataOps
Connect all your machines and systems with our Open-Source IT/OT Integration Platform to make all shop-floor data accessible at a single point.


